Immigrants from Mexico vs Filipino Householder Income Under 25 years

COMPARE

Immigrants from Mexico
Race
Ancestry
AfghanAfricanAlaska NativeAlaskan AthabascanAlbanianAleutAlsatianAmericanApacheArabArapahoArgentineanArmenianAssyrian/Chaldean/SyriacAustralianAustrianBahamianBangladeshiBarbadianBasqueBelgianBelizeanBermudanBhutaneseBlackfeetBolivianBrazilianBritishBritish West IndianBulgarianBurmeseCajunCambodianCanadianCape VerdeanCarpatho RusynCelticCentral AmericanCentral American IndianCherokeeCheyenneChickasawChileanChineseChippewaChoctawColombianColvilleComancheCosta RicanCreeCreekCroatianCrowCubanCypriotCzechCzechoslovakianDanishDelawareDominicanDutchDutch West IndianEastern EuropeanEcuadorianEgyptianEnglishEstonianEthiopianEuropeanFijianFinnishFrenchFrench American IndianFrench CanadianGermanGerman RussianGhanaianGreekGuamanian/ChamorroGuatemalanGuyaneseHaitianHmongHonduranHopiHoumaHungarianIcelanderIndian (Asian)IndonesianInupiatIranianIraqiIrishIroquoisIsraeliItalianJamaicanJapaneseJordanianKenyanKiowaKoreanLaotianLatvianLebaneseLiberianLithuanianLumbeeLuxembourgerMacedonianMalaysianMalteseMarshalleseMenomineeMexicanMexican American IndianMongolianMoroccanNative HawaiianNavajoNepaleseNew ZealanderNicaraguanNigerianNorthern EuropeanNorwegianOkinawanOsageOttawaPaiutePakistaniPalestinianPanamanianParaguayanPennsylvania GermanPeruvianPimaPolishPortuguesePotawatomiPuebloPuerto RicanPuget Sound SalishRomanianRussianSalvadoranSamoanScandinavianScotch-IrishScottishSeminoleSenegaleseSerbianShoshoneSierra LeoneanSiouxSlavicSlovakSloveneSomaliSouth AfricanSouth AmericanSouth American IndianSoviet UnionSpaniardSpanishSpanish AmericanSpanish American IndianSri LankanSubsaharan AfricanSudaneseSwedishSwissSyrianTaiwaneseThaiTlingit-HaidaTohono O'OdhamTonganTrinidadian and TobagonianTsimshianTurkishU.S. Virgin IslanderUgandanUkrainianUruguayanUteVenezuelanVietnameseWelshWest IndianYakamaYaquiYugoslavianYumanYup'ikZimbabwean
Immigration
NonimmigrantsImmigrantsAfghanistanAfricaAlbaniaArgentinaArmeniaAsiaAustraliaAustriaBahamasBangladeshBarbadosBelarusBelgiumBelizeBoliviaBosnia and HerzegovinaBrazilBulgariaBurma/MyanmarCabo VerdeCambodiaCameroonCanadaCaribbeanCentral AmericaChileChinaColombiaCongoCosta RicaCroatiaCubaCzechoslovakiaDenmarkDominicaDominican RepublicEastern AfricaEastern AsiaEastern EuropeEcuadorEgyptEl SalvadorEnglandEritreaEthiopiaEuropeFijiFranceGermanyGhanaGreeceGrenadaGuatemalaGuyanaHaitiHondurasHong KongHungaryIndiaIndonesiaIranIraqIrelandIsraelItalyJamaicaJapanJordanKazakhstanKenyaKoreaKuwaitLaosLatin AmericaLatviaLebanonLiberiaLithuaniaMalaysiaMexicoMicronesiaMiddle AfricaMoldovaMoroccoNepalNetherlandsNicaraguaNigeriaNorth AmericaNorth MacedoniaNorthern AfricaNorthern EuropeNorwayOceaniaPakistanPanamaPeruPhilippinesPolandPortugalRomaniaRussiaSaudi ArabiaScotlandSenegalSerbiaSierra LeoneSingaporeSomaliaSouth AfricaSouth AmericaSouth Central AsiaSouth Eastern AsiaSouthern EuropeSpainSri LankaSt. Vincent and the GrenadinesSudanSwedenSwitzerlandSyriaTaiwanThailandTrinidad and TobagoTurkeyUgandaUkraineUruguayUzbekistanVenezuelaVietnamWest IndiesWestern AfricaWestern AsiaWestern EuropeYemenZaireZimbabweAzores
Filipino
Race
Ancestry
AfghanAfricanAlaska NativeAlaskan AthabascanAlbanianAleutAlsatianAmericanApacheArabArapahoArgentineanArmenianAssyrian/Chaldean/SyriacAustralianAustrianBahamianBangladeshiBarbadianBasqueBelgianBelizeanBermudanBhutaneseBlackfeetBolivianBrazilianBritishBritish West IndianBulgarianBurmeseCajunCambodianCanadianCape VerdeanCarpatho RusynCelticCentral AmericanCentral American IndianCherokeeCheyenneChickasawChileanChineseChippewaChoctawColombianColvilleComancheCosta RicanCreeCreekCroatianCrowCubanCypriotCzechCzechoslovakianDanishDelawareDominicanDutchDutch West IndianEastern EuropeanEcuadorianEgyptianEnglishEstonianEthiopianEuropeanFijianFilipinoFinnishFrenchFrench American IndianFrench CanadianGermanGerman RussianGhanaianGreekGuamanian/ChamorroGuatemalanGuyaneseHaitianHmongHonduranHopiHoumaHungarianIcelanderIndian (Asian)IndonesianInupiatIranianIraqiIrishIroquoisIsraeliItalianJamaicanJapaneseJordanianKenyanKiowaKoreanLaotianLatvianLebaneseLiberianLithuanianLumbeeLuxembourgerMacedonianMalaysianMalteseMarshalleseMenomineeMexicanMexican American IndianMongolianMoroccanNative HawaiianNavajoNepaleseNew ZealanderNicaraguanNigerianNorthern EuropeanNorwegianOkinawanOsageOttawaPaiutePakistaniPalestinianPanamanianParaguayanPennsylvania GermanPeruvianPimaPolishPortuguesePotawatomiPuebloPuerto RicanPuget Sound SalishRomanianRussianSalvadoranSamoanScandinavianScotch-IrishScottishSeminoleSenegaleseSerbianShoshoneSierra LeoneanSiouxSlavicSlovakSloveneSomaliSouth AfricanSouth AmericanSouth American IndianSoviet UnionSpaniardSpanishSpanish AmericanSpanish American IndianSri LankanSubsaharan AfricanSudaneseSwedishSwissSyrianTaiwaneseThaiTlingit-HaidaTohono O'OdhamTonganTrinidadian and TobagonianTsimshianTurkishU.S. Virgin IslanderUgandanUkrainianUruguayanUteVenezuelanVietnameseWelshWest IndianYakamaYaquiYugoslavianYumanYup'ikZimbabwean
Immigration
NonimmigrantsImmigrantsAfghanistanAfricaAlbaniaArgentinaArmeniaAsiaAustraliaAustriaBahamasBangladeshBarbadosBelarusBelgiumBelizeBoliviaBosnia and HerzegovinaBrazilBulgariaBurma/MyanmarCabo VerdeCambodiaCameroonCanadaCaribbeanCentral AmericaChileChinaColombiaCongoCosta RicaCroatiaCubaCzechoslovakiaDenmarkDominicaDominican RepublicEastern AfricaEastern AsiaEastern EuropeEcuadorEgyptEl SalvadorEnglandEritreaEthiopiaEuropeFijiFranceGermanyGhanaGreeceGrenadaGuatemalaGuyanaHaitiHondurasHong KongHungaryIndiaIndonesiaIranIraqIrelandIsraelItalyJamaicaJapanJordanKazakhstanKenyaKoreaKuwaitLaosLatin AmericaLatviaLebanonLiberiaLithuaniaMalaysiaMicronesiaMiddle AfricaMoldovaMoroccoNepalNetherlandsNicaraguaNigeriaNorth AmericaNorth MacedoniaNorthern AfricaNorthern EuropeNorwayOceaniaPakistanPanamaPeruPhilippinesPolandPortugalRomaniaRussiaSaudi ArabiaScotlandSenegalSerbiaSierra LeoneSingaporeSomaliaSouth AfricaSouth AmericaSouth Central AsiaSouth Eastern AsiaSouthern EuropeSpainSri LankaSt. Vincent and the GrenadinesSudanSwedenSwitzerlandSyriaTaiwanThailandTrinidad and TobagoTurkeyUgandaUkraineUruguayUzbekistanVenezuelaVietnamWest IndiesWestern AfricaWestern AsiaWestern EuropeYemenZaireZimbabweAzores
Householder Income Under 25 years
Income
Poverty
Unemployment
Labor Participation
Family Structure
Vehicle Availability
Education Level
Disability

Householder Income Under 25 years Comparison

Immigrants from Mexico

Filipinos

Tragic
Exceptional
$50,422
HOUSEHOLDER INCOME UNDER 25 YEARS
1.3/ 100
METRIC RATING
252nd/ 347
METRIC RANK
$57,740
HOUSEHOLDER INCOME UNDER 25 YEARS
100.0/ 100
METRIC RATING
14th/ 347
METRIC RANK

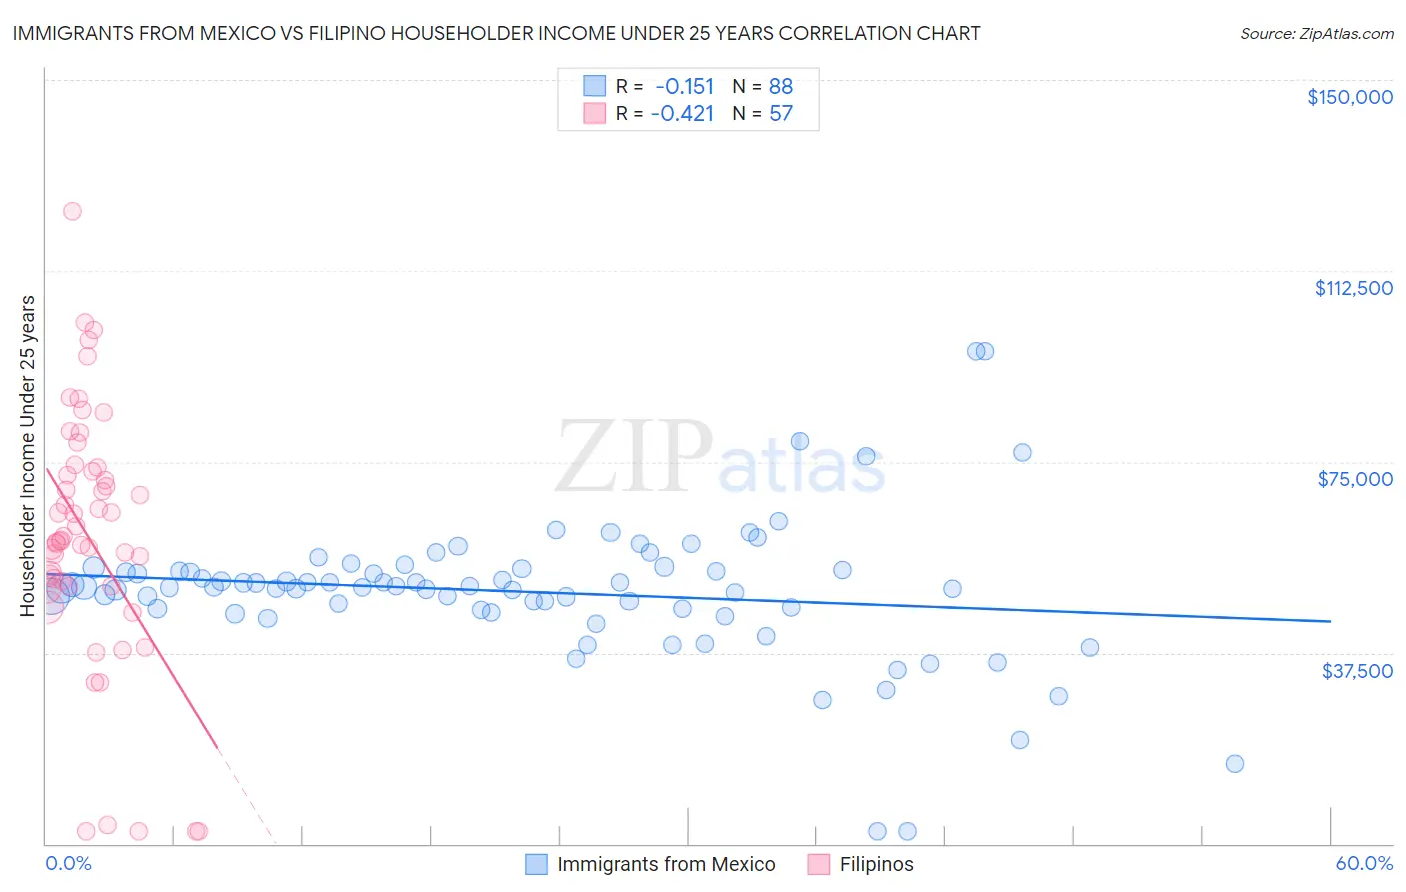
Immigrants from Mexico vs Filipino Householder Income Under 25 years Correlation Chart

The statistical analysis conducted on geographies consisting of 414,348,765 people shows a poor negative correlation between the proportion of Immigrants from Mexico and household income with householder under the age of 25 in the United States with a correlation coefficient (R) of -0.151 and weighted average of $50,422. Similarly, the statistical analysis conducted on geographies consisting of 221,803,900 people shows a moderate negative correlation between the proportion of Filipinos and household income with householder under the age of 25 in the United States with a correlation coefficient (R) of -0.421 and weighted average of $57,740, a difference of 14.5%.
Immigrants from Mexico vs Filipino Householder Income Under 25 years

Householder Income Under 25 years Correlation Summary

MeasurementImmigrants from MexicoFilipino
Minimum$2,499$2,499
Maximum$96,667$124,201
Range$94,168$121,702
Mean$49,454$60,102
Median$50,399$59,572
Interquartile 25% (IQ1)$45,992$50,565
Interquartile 75% (IQ3)$53,646$73,535
Interquartile Range (IQR)$7,654$22,969
Standard Deviation (Sample)$14,134$25,401
Standard Deviation (Population)$14,054$25,177

Similar Demographics by Householder Income Under 25 years

Demographics Similar to Immigrants from Mexico by Householder Income Under 25 years

In terms of householder income under 25 years, the demographic groups most similar to Immigrants from Mexico are Celtic ($50,447, a difference of 0.050%), Immigrants from Haiti ($50,398, a difference of 0.050%), Luxembourger ($50,379, a difference of 0.080%), Aleut ($50,377, a difference of 0.090%), and Immigrants from Cuba ($50,374, a difference of 0.090%).
DemographicsRating | RankHouseholder Income Under 25 years
Immigrants | Africa
2.0
/100
|
#245
Tragic
$50,609
Welsh
2.0
/100
|
#246
Tragic
$50,597
Immigrants | Bosnia and Herzegovina
1.8
/100
|
#247
Tragic
$50,565
Slavs
1.8
/100
|
#248
Tragic
$50,563
Scottish
1.8
/100
|
#249
Tragic
$50,554
Immigrants | Cabo Verde
1.7
/100
|
#250
Tragic
$50,520
Celtics
1.4
/100
|
#251
Tragic
$50,447
Immigrants | Mexico
1.3
/100
|
#252
Tragic
$50,422
Immigrants | Haiti
1.2
/100
|
#253
Tragic
$50,398
Luxembourgers
1.2
/100
|
#254
Tragic
$50,379
Aleuts
1.2
/100
|
#255
Tragic
$50,377
Immigrants | Cuba
1.2
/100
|
#256
Tragic
$50,374
Lebanese
1.1
/100
|
#257
Tragic
$50,355
Whites/Caucasians
1.1
/100
|
#258
Tragic
$50,336
Immigrants | Dominica
1.0
/100
|
#259
Tragic
$50,301

Demographics Similar to Filipinos by Householder Income Under 25 years

In terms of householder income under 25 years, the demographic groups most similar to Filipinos are Korean ($57,730, a difference of 0.020%), Immigrants from South Central Asia ($57,818, a difference of 0.14%), Immigrants from China ($57,931, a difference of 0.33%), Immigrants from Philippines ($57,930, a difference of 0.33%), and Immigrants from Afghanistan ($57,478, a difference of 0.46%).
DemographicsRating | RankHouseholder Income Under 25 years
Bolivians
100.0
/100
|
#7
Exceptional
$58,506
Indians (Asian)
100.0
/100
|
#8
Exceptional
$58,239
Chinese
100.0
/100
|
#9
Exceptional
$58,162
Afghans
100.0
/100
|
#10
Exceptional
$58,019
Immigrants | China
100.0
/100
|
#11
Exceptional
$57,931
Immigrants | Philippines
100.0
/100
|
#12
Exceptional
$57,930
Immigrants | South Central Asia
100.0
/100
|
#13
Exceptional
$57,818
Filipinos
100.0
/100
|
#14
Exceptional
$57,740
Koreans
100.0
/100
|
#15
Exceptional
$57,730
Immigrants | Afghanistan
100.0
/100
|
#16
Exceptional
$57,478
Sierra Leoneans
100.0
/100
|
#17
Exceptional
$57,272
Immigrants | Eastern Asia
100.0
/100
|
#18
Exceptional
$57,123
Bhutanese
100.0
/100
|
#19
Exceptional
$57,078
Immigrants | Ireland
100.0
/100
|
#20
Exceptional
$57,075
Immigrants | Fiji
100.0
/100
|
#21
Exceptional
$57,074