Immigrants from Mexico vs Creek Per Capita Income
COMPARE
Immigrants from Mexico
Creek
Per Capita Income
Per Capita Income Comparison
Immigrants from Mexico
Creek
$33,931
PER CAPITA INCOME
0.0/ 100
METRIC RATING
331st/ 347
METRIC RANK
$35,546
PER CAPITA INCOME
0.0/ 100
METRIC RATING
322nd/ 347
METRIC RANK
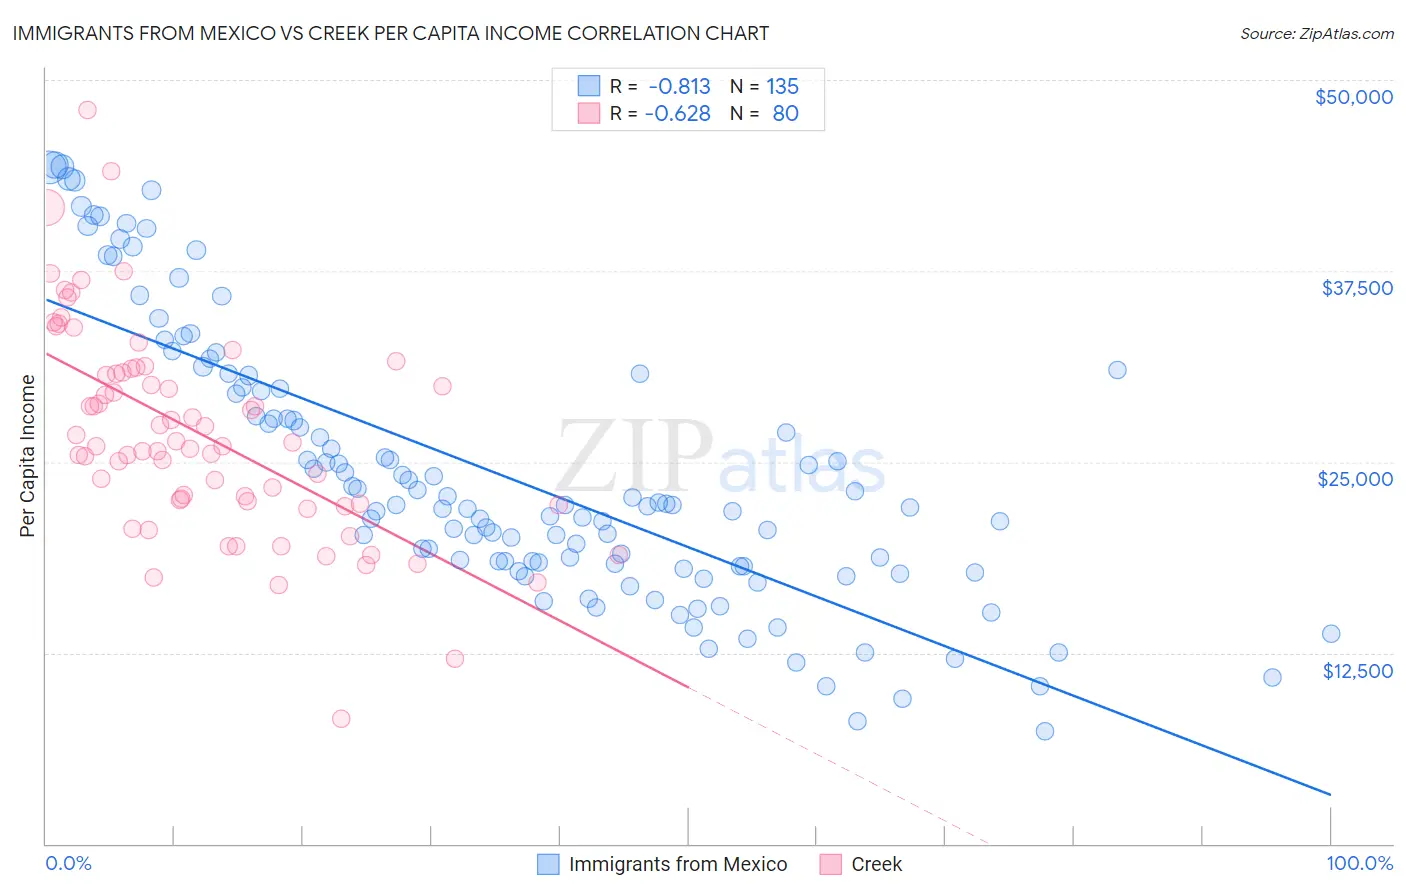
Immigrants from Mexico vs Creek Per Capita Income Correlation Chart
The statistical analysis conducted on geographies consisting of 513,776,249 people shows a very strong negative correlation between the proportion of Immigrants from Mexico and per capita income in the United States with a correlation coefficient (R) of -0.813 and weighted average of $33,931. Similarly, the statistical analysis conducted on geographies consisting of 178,484,884 people shows a significant negative correlation between the proportion of Creek and per capita income in the United States with a correlation coefficient (R) of -0.628 and weighted average of $35,546, a difference of 4.8%.
Per Capita Income Correlation Summary
| Measurement | Immigrants from Mexico | Creek |
| Minimum | $7,365 | $8,185 |
| Maximum | $44,424 | $48,038 |
| Range | $37,059 | $39,853 |
| Mean | $24,192 | $26,882 |
| Median | $22,163 | $26,137 |
| Interquartile 25% (IQ1) | $18,195 | $22,339 |
| Interquartile 75% (IQ3) | $29,815 | $30,941 |
| Interquartile Range (IQR) | $11,620 | $8,603 |
| Standard Deviation (Sample) | $8,892 | $6,895 |
| Standard Deviation (Population) | $8,859 | $6,852 |
Demographics Similar to Immigrants from Mexico and Creek by Per Capita Income
In terms of per capita income, the demographic groups most similar to Immigrants from Mexico are Sioux ($33,921, a difference of 0.030%), Immigrants from Yemen ($33,696, a difference of 0.70%), Spanish American Indian ($34,195, a difference of 0.78%), Mexican ($34,559, a difference of 1.8%), and Menominee ($34,578, a difference of 1.9%). Similarly, the demographic groups most similar to Creek are Black/African American ($35,564, a difference of 0.050%), Hispanic or Latino ($35,688, a difference of 0.40%), Immigrants from Congo ($35,720, a difference of 0.49%), Cheyenne ($35,276, a difference of 0.76%), and Bangladeshi ($35,897, a difference of 0.99%).
| Demographics | Rating | Rank | Per Capita Income |
| Choctaw | 0.0 /100 | #316 | Tragic $35,999 |
| Dutch West Indians | 0.0 /100 | #317 | Tragic $35,922 |
| Bangladeshis | 0.0 /100 | #318 | Tragic $35,897 |
| Immigrants | Congo | 0.0 /100 | #319 | Tragic $35,720 |
| Hispanics or Latinos | 0.0 /100 | #320 | Tragic $35,688 |
| Blacks/African Americans | 0.0 /100 | #321 | Tragic $35,564 |
| Creek | 0.0 /100 | #322 | Tragic $35,546 |
| Cheyenne | 0.0 /100 | #323 | Tragic $35,276 |
| Kiowa | 0.0 /100 | #324 | Tragic $35,102 |
| Immigrants | Central America | 0.0 /100 | #325 | Tragic $34,974 |
| Immigrants | Cuba | 0.0 /100 | #326 | Tragic $34,910 |
| Apache | 0.0 /100 | #327 | Tragic $34,886 |
| Menominee | 0.0 /100 | #328 | Tragic $34,578 |
| Mexicans | 0.0 /100 | #329 | Tragic $34,559 |
| Spanish American Indians | 0.0 /100 | #330 | Tragic $34,195 |
| Immigrants | Mexico | 0.0 /100 | #331 | Tragic $33,931 |
| Sioux | 0.0 /100 | #332 | Tragic $33,921 |
| Immigrants | Yemen | 0.0 /100 | #333 | Tragic $33,696 |
| Natives/Alaskans | 0.0 /100 | #334 | Tragic $33,279 |
| Yuman | 0.0 /100 | #335 | Tragic $33,236 |
| Yakama | 0.0 /100 | #336 | Tragic $33,009 |