Immigrants from Malaysia vs Paraguayan Wage/Income Gap
COMPARE
Immigrants from Malaysia
Paraguayan
Wage/Income Gap
Wage/Income Gap Comparison
Immigrants from Malaysia
Paraguayans
26.3%
WAGE/INCOME GAP
22.2/ 100
METRIC RATING
195th/ 347
METRIC RANK
25.8%
WAGE/INCOME GAP
46.7/ 100
METRIC RATING
176th/ 347
METRIC RANK
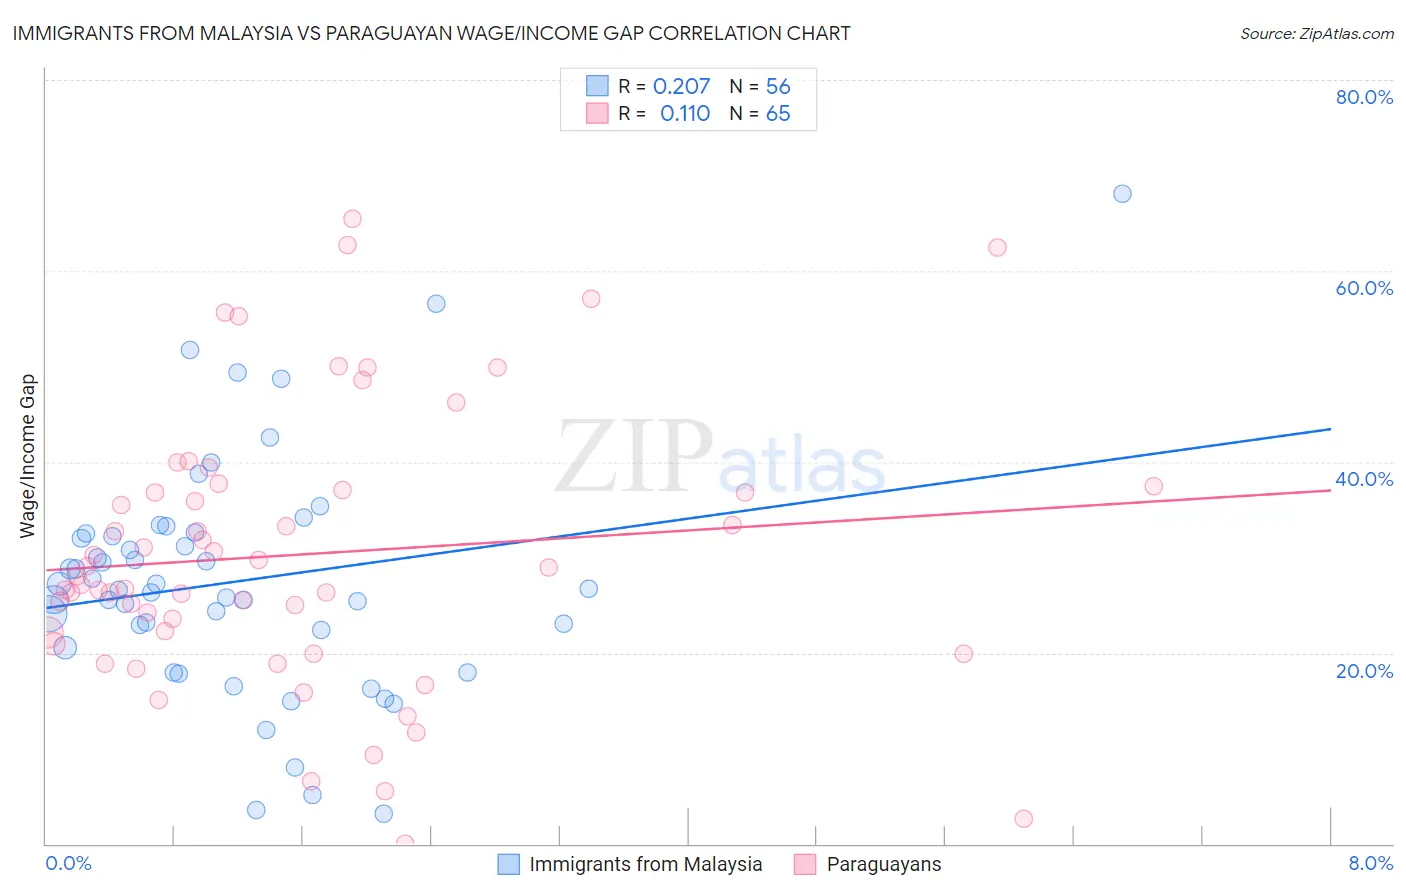
Immigrants from Malaysia vs Paraguayan Wage/Income Gap Correlation Chart
The statistical analysis conducted on geographies consisting of 197,939,281 people shows a weak positive correlation between the proportion of Immigrants from Malaysia and wage/income gap percentage in the United States with a correlation coefficient (R) of 0.207 and weighted average of 26.3%. Similarly, the statistical analysis conducted on geographies consisting of 95,100,210 people shows a poor positive correlation between the proportion of Paraguayans and wage/income gap percentage in the United States with a correlation coefficient (R) of 0.110 and weighted average of 25.8%, a difference of 1.8%.
Wage/Income Gap Correlation Summary
| Measurement | Immigrants from Malaysia | Paraguayan |
| Minimum | 3.1% | 0.048% |
| Maximum | 68.0% | 65.5% |
| Range | 64.9% | 65.4% |
| Mean | 27.5% | 30.3% |
| Median | 26.6% | 28.0% |
| Interquartile 25% (IQ1) | 21.5% | 21.5% |
| Interquartile 75% (IQ3) | 32.4% | 37.3% |
| Interquartile Range (IQR) | 10.9% | 15.8% |
| Standard Deviation (Sample) | 12.3% | 14.5% |
| Standard Deviation (Population) | 12.2% | 14.3% |
Demographics Similar to Immigrants from Malaysia and Paraguayans by Wage/Income Gap
In terms of wage/income gap, the demographic groups most similar to Immigrants from Malaysia are Chilean (26.3%, a difference of 0.010%), Immigrants from Jordan (26.3%, a difference of 0.020%), Immigrants from Bulgaria (26.3%, a difference of 0.030%), Immigrants from Venezuela (26.2%, a difference of 0.22%), and Immigrants from Croatia (26.2%, a difference of 0.24%). Similarly, the demographic groups most similar to Paraguayans are Sri Lankan (25.8%, a difference of 0.020%), Cambodian (25.8%, a difference of 0.11%), Chinese (25.9%, a difference of 0.32%), Samoan (26.0%, a difference of 0.54%), and Guamanian/Chamorro (26.0%, a difference of 0.58%).
| Demographics | Rating | Rank | Wage/Income Gap |
| Sri Lankans | 47.0 /100 | #175 | Average 25.8% |
| Paraguayans | 46.7 /100 | #176 | Average 25.8% |
| Cambodians | 45.1 /100 | #177 | Average 25.8% |
| Chinese | 42.0 /100 | #178 | Average 25.9% |
| Samoans | 38.6 /100 | #179 | Fair 26.0% |
| Guamanians/Chamorros | 38.0 /100 | #180 | Fair 26.0% |
| Immigrants | Bolivia | 36.4 /100 | #181 | Fair 26.0% |
| Immigrants | Serbia | 35.4 /100 | #182 | Fair 26.0% |
| Immigrants | Kazakhstan | 35.2 /100 | #183 | Fair 26.0% |
| Mexicans | 34.4 /100 | #184 | Fair 26.0% |
| Pakistanis | 33.7 /100 | #185 | Fair 26.1% |
| Immigrants | Indonesia | 32.5 /100 | #186 | Fair 26.1% |
| Palestinians | 29.9 /100 | #187 | Fair 26.1% |
| Immigrants | Egypt | 29.9 /100 | #188 | Fair 26.1% |
| Immigrants | Moldova | 26.6 /100 | #189 | Fair 26.2% |
| Immigrants | Croatia | 24.8 /100 | #190 | Fair 26.2% |
| Immigrants | Venezuela | 24.7 /100 | #191 | Fair 26.2% |
| Immigrants | Bulgaria | 22.5 /100 | #192 | Fair 26.3% |
| Immigrants | Jordan | 22.4 /100 | #193 | Fair 26.3% |
| Chileans | 22.3 /100 | #194 | Fair 26.3% |
| Immigrants | Malaysia | 22.2 /100 | #195 | Fair 26.3% |