Immigrants from Malaysia vs Korean Median Household Income
COMPARE
Immigrants from Malaysia
Korean
Median Household Income
Median Household Income Comparison
Immigrants from Malaysia
Koreans
$96,292
MEDIAN HOUSEHOLD INCOME
99.9/ 100
METRIC RATING
49th/ 347
METRIC RANK
$95,018
MEDIAN HOUSEHOLD INCOME
99.8/ 100
METRIC RATING
60th/ 347
METRIC RANK
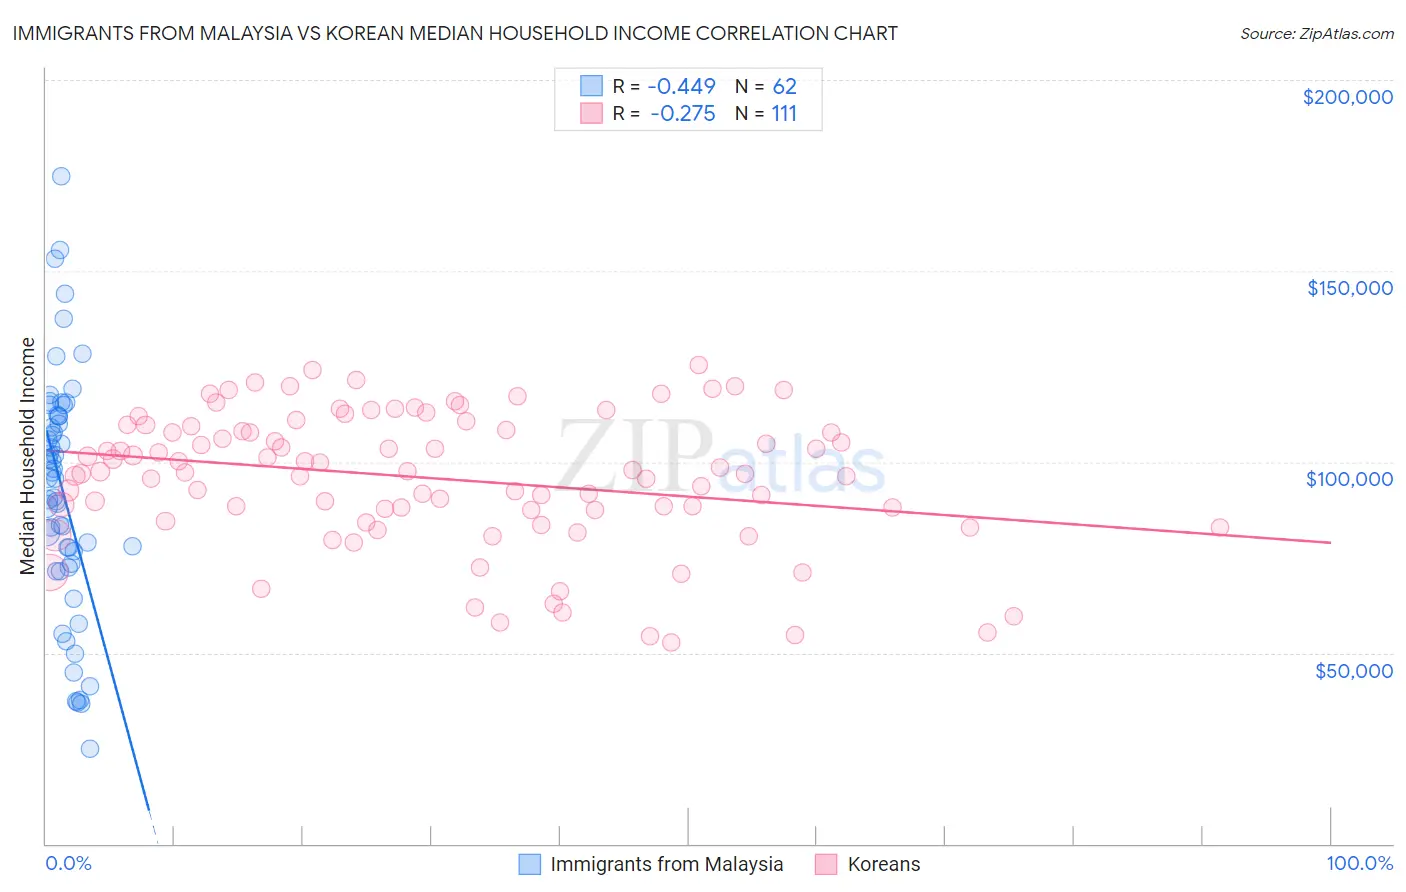
Immigrants from Malaysia vs Korean Median Household Income Correlation Chart
The statistical analysis conducted on geographies consisting of 197,902,730 people shows a moderate negative correlation between the proportion of Immigrants from Malaysia and median household income in the United States with a correlation coefficient (R) of -0.449 and weighted average of $96,292. Similarly, the statistical analysis conducted on geographies consisting of 510,219,050 people shows a weak negative correlation between the proportion of Koreans and median household income in the United States with a correlation coefficient (R) of -0.275 and weighted average of $95,018, a difference of 1.3%.
Median Household Income Correlation Summary
| Measurement | Immigrants from Malaysia | Korean |
| Minimum | $25,000 | $52,792 |
| Maximum | $174,680 | $125,300 |
| Range | $149,680 | $72,508 |
| Mean | $92,009 | $95,651 |
| Median | $95,719 | $97,407 |
| Interquartile 25% (IQ1) | $73,336 | $87,266 |
| Interquartile 75% (IQ3) | $111,923 | $109,366 |
| Interquartile Range (IQR) | $38,587 | $22,100 |
| Standard Deviation (Sample) | $31,412 | $17,558 |
| Standard Deviation (Population) | $31,158 | $17,478 |
Demographics Similar to Immigrants from Malaysia and Koreans by Median Household Income
In terms of median household income, the demographic groups most similar to Immigrants from Malaysia are Bulgarian ($96,290, a difference of 0.0%), Cambodian ($96,324, a difference of 0.030%), Immigrants from Russia ($96,378, a difference of 0.090%), Australian ($96,490, a difference of 0.21%), and Israeli ($96,552, a difference of 0.27%). Similarly, the demographic groups most similar to Koreans are Immigrants from Europe ($95,032, a difference of 0.020%), Laotian ($94,990, a difference of 0.030%), Soviet Union ($95,098, a difference of 0.080%), New Zealander ($95,146, a difference of 0.13%), and Immigrants from Norway ($94,846, a difference of 0.18%).
| Demographics | Rating | Rank | Median Household Income |
| Immigrants | Greece | 99.9 /100 | #44 | Exceptional $96,675 |
| Israelis | 99.9 /100 | #45 | Exceptional $96,552 |
| Australians | 99.9 /100 | #46 | Exceptional $96,490 |
| Immigrants | Russia | 99.9 /100 | #47 | Exceptional $96,378 |
| Cambodians | 99.9 /100 | #48 | Exceptional $96,324 |
| Immigrants | Malaysia | 99.9 /100 | #49 | Exceptional $96,292 |
| Bulgarians | 99.9 /100 | #50 | Exceptional $96,290 |
| Estonians | 99.9 /100 | #51 | Exceptional $95,930 |
| Immigrants | South Africa | 99.9 /100 | #52 | Exceptional $95,800 |
| Paraguayans | 99.9 /100 | #53 | Exceptional $95,737 |
| Egyptians | 99.9 /100 | #54 | Exceptional $95,673 |
| Immigrants | Czechoslovakia | 99.9 /100 | #55 | Exceptional $95,319 |
| Immigrants | Austria | 99.9 /100 | #56 | Exceptional $95,277 |
| New Zealanders | 99.8 /100 | #57 | Exceptional $95,146 |
| Soviet Union | 99.8 /100 | #58 | Exceptional $95,098 |
| Immigrants | Europe | 99.8 /100 | #59 | Exceptional $95,032 |
| Koreans | 99.8 /100 | #60 | Exceptional $95,018 |
| Laotians | 99.8 /100 | #61 | Exceptional $94,990 |
| Immigrants | Norway | 99.8 /100 | #62 | Exceptional $94,846 |
| Greeks | 99.8 /100 | #63 | Exceptional $94,735 |
| Immigrants | Netherlands | 99.7 /100 | #64 | Exceptional $94,411 |