Immigrants from Malaysia vs Italian Median Earnings
COMPARE
Immigrants from Malaysia
Italian
Median Earnings
Median Earnings Comparison
Immigrants from Malaysia
Italians
$52,514
MEDIAN EARNINGS
100.0/ 100
METRIC RATING
43rd/ 347
METRIC RANK
$49,915
MEDIAN EARNINGS
99.3/ 100
METRIC RATING
90th/ 347
METRIC RANK
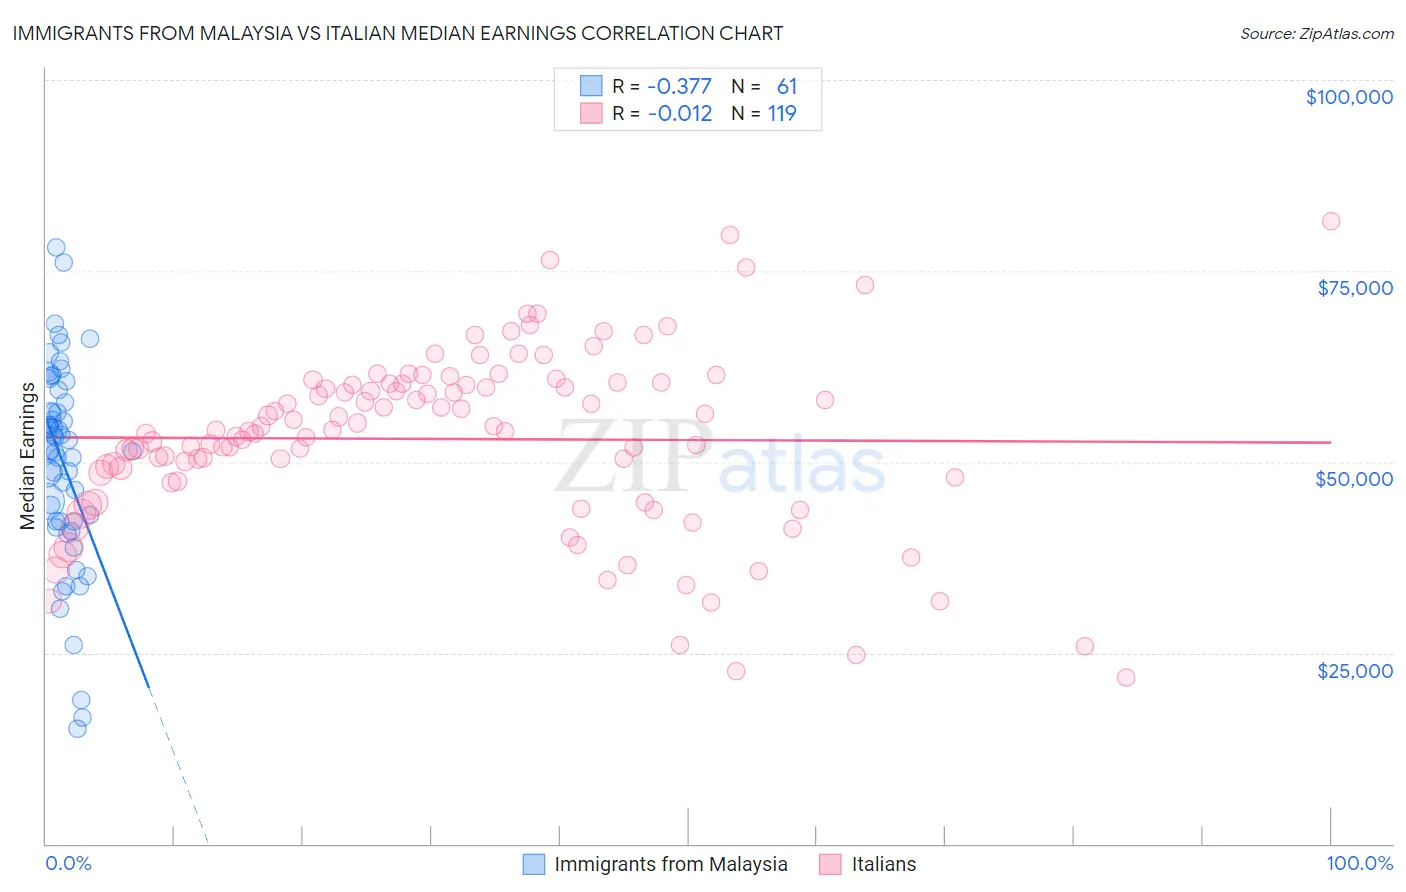
Immigrants from Malaysia vs Italian Median Earnings Correlation Chart
The statistical analysis conducted on geographies consisting of 197,951,300 people shows a mild negative correlation between the proportion of Immigrants from Malaysia and median earnings in the United States with a correlation coefficient (R) of -0.377 and weighted average of $52,514. Similarly, the statistical analysis conducted on geographies consisting of 574,669,176 people shows no correlation between the proportion of Italians and median earnings in the United States with a correlation coefficient (R) of -0.012 and weighted average of $49,915, a difference of 5.2%.
Median Earnings Correlation Summary
| Measurement | Immigrants from Malaysia | Italian |
| Minimum | $15,000 | $21,728 |
| Maximum | $78,075 | $81,458 |
| Range | $63,075 | $59,730 |
| Mean | $49,921 | $52,992 |
| Median | $51,741 | $54,091 |
| Interquartile 25% (IQ1) | $42,220 | $47,401 |
| Interquartile 75% (IQ3) | $58,605 | $60,200 |
| Interquartile Range (IQR) | $16,385 | $12,799 |
| Standard Deviation (Sample) | $13,176 | $11,690 |
| Standard Deviation (Population) | $13,067 | $11,640 |
Similar Demographics by Median Earnings
Demographics Similar to Immigrants from Malaysia by Median Earnings
In terms of median earnings, the demographic groups most similar to Immigrants from Malaysia are Bulgarian ($52,512, a difference of 0.0%), Maltese ($52,526, a difference of 0.020%), Immigrants from Czechoslovakia ($52,361, a difference of 0.29%), Bhutanese ($52,297, a difference of 0.41%), and Australian ($52,294, a difference of 0.42%).
| Demographics | Rating | Rank | Median Earnings |
| Immigrants | Denmark | 100.0 /100 | #36 | Exceptional $53,186 |
| Immigrants | Belarus | 100.0 /100 | #37 | Exceptional $53,043 |
| Latvians | 100.0 /100 | #38 | Exceptional $53,001 |
| Immigrants | Turkey | 100.0 /100 | #39 | Exceptional $52,960 |
| Israelis | 100.0 /100 | #40 | Exceptional $52,937 |
| Immigrants | Lithuania | 100.0 /100 | #41 | Exceptional $52,769 |
| Maltese | 100.0 /100 | #42 | Exceptional $52,526 |
| Immigrants | Malaysia | 100.0 /100 | #43 | Exceptional $52,514 |
| Bulgarians | 100.0 /100 | #44 | Exceptional $52,512 |
| Immigrants | Czechoslovakia | 100.0 /100 | #45 | Exceptional $52,361 |
| Bhutanese | 100.0 /100 | #46 | Exceptional $52,297 |
| Australians | 100.0 /100 | #47 | Exceptional $52,294 |
| Immigrants | Europe | 100.0 /100 | #48 | Exceptional $52,195 |
| Bolivians | 100.0 /100 | #49 | Exceptional $52,005 |
| Immigrants | South Africa | 100.0 /100 | #50 | Exceptional $51,850 |
Demographics Similar to Italians by Median Earnings
In terms of median earnings, the demographic groups most similar to Italians are Macedonian ($49,893, a difference of 0.040%), Immigrants from Argentina ($49,841, a difference of 0.15%), Armenian ($49,804, a difference of 0.22%), Croatian ($49,724, a difference of 0.38%), and Immigrants from North America ($50,108, a difference of 0.39%).
| Demographics | Rating | Rank | Median Earnings |
| Romanians | 99.5 /100 | #83 | Exceptional $50,244 |
| Immigrants | Hungary | 99.5 /100 | #84 | Exceptional $50,227 |
| Immigrants | Kazakhstan | 99.5 /100 | #85 | Exceptional $50,225 |
| Immigrants | Canada | 99.5 /100 | #86 | Exceptional $50,192 |
| Immigrants | Uzbekistan | 99.5 /100 | #87 | Exceptional $50,151 |
| Albanians | 99.4 /100 | #88 | Exceptional $50,116 |
| Immigrants | North America | 99.4 /100 | #89 | Exceptional $50,108 |
| Italians | 99.3 /100 | #90 | Exceptional $49,915 |
| Macedonians | 99.2 /100 | #91 | Exceptional $49,893 |
| Immigrants | Argentina | 99.2 /100 | #92 | Exceptional $49,841 |
| Armenians | 99.1 /100 | #93 | Exceptional $49,804 |
| Croatians | 99.0 /100 | #94 | Exceptional $49,724 |
| Immigrants | England | 99.0 /100 | #95 | Exceptional $49,722 |
| Immigrants | Lebanon | 99.0 /100 | #96 | Exceptional $49,682 |
| Immigrants | North Macedonia | 98.9 /100 | #97 | Exceptional $49,658 |