Immigrants from Malaysia vs Immigrants from South Central Asia Median Male Earnings
COMPARE
Immigrants from Malaysia
Immigrants from South Central Asia
Median Male Earnings
Median Male Earnings Comparison
Immigrants from Malaysia
Immigrants from South Central Asia
$62,121
MEDIAN MALE EARNINGS
99.9/ 100
METRIC RATING
48th/ 347
METRIC RANK
$68,960
MEDIAN MALE EARNINGS
100.0/ 100
METRIC RATING
9th/ 347
METRIC RANK
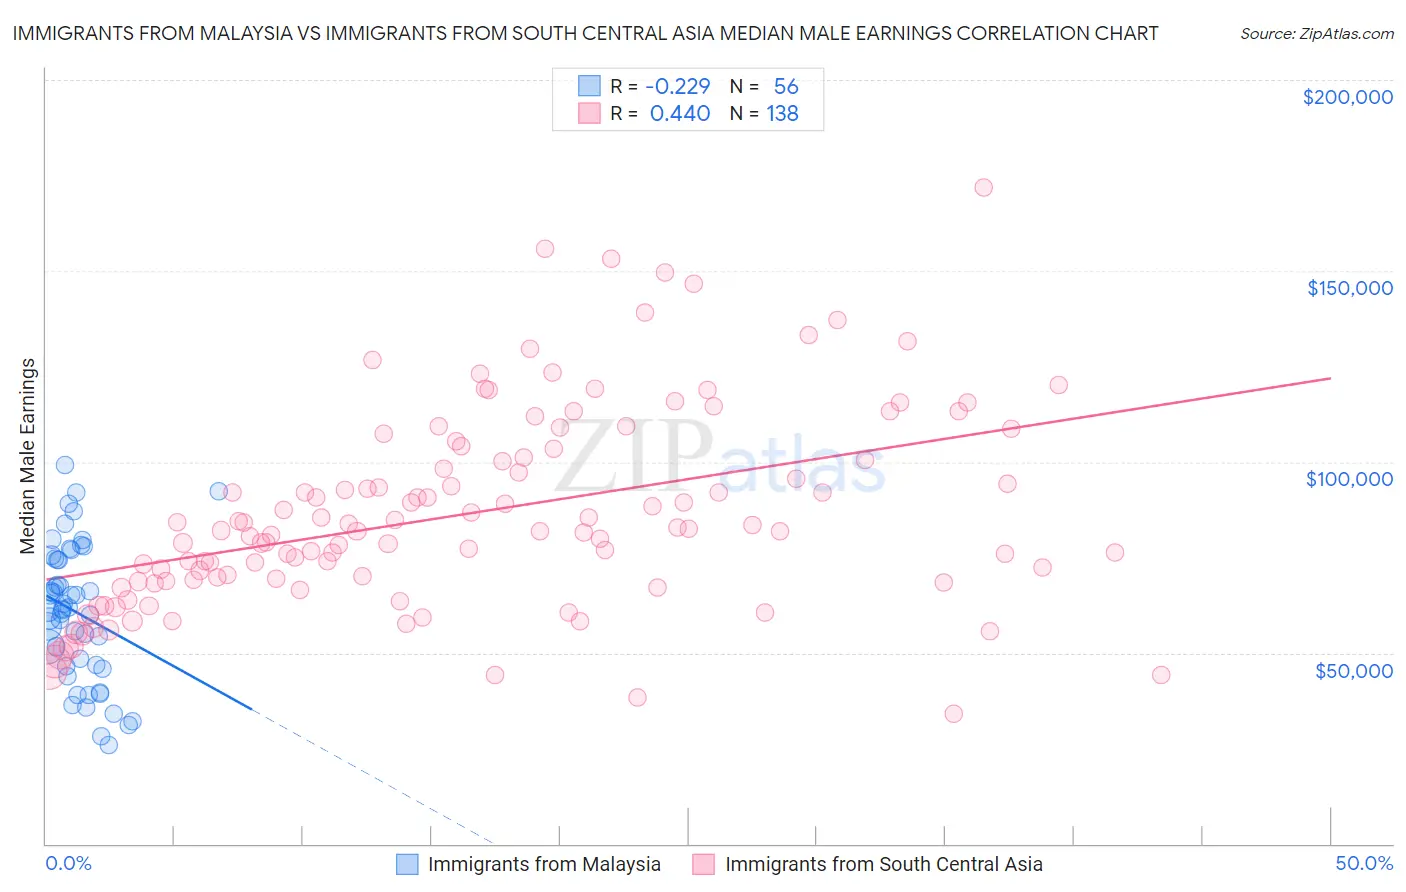
Immigrants from Malaysia vs Immigrants from South Central Asia Median Male Earnings Correlation Chart
The statistical analysis conducted on geographies consisting of 197,949,905 people shows a weak negative correlation between the proportion of Immigrants from Malaysia and median male earnings in the United States with a correlation coefficient (R) of -0.229 and weighted average of $62,121. Similarly, the statistical analysis conducted on geographies consisting of 472,946,789 people shows a moderate positive correlation between the proportion of Immigrants from South Central Asia and median male earnings in the United States with a correlation coefficient (R) of 0.440 and weighted average of $68,960, a difference of 11.0%.
Median Male Earnings Correlation Summary
| Measurement | Immigrants from Malaysia | Immigrants from South Central Asia |
| Minimum | $25,921 | $34,167 |
| Maximum | $99,264 | $171,875 |
| Range | $73,343 | $137,708 |
| Mean | $60,570 | $86,430 |
| Median | $61,469 | $81,870 |
| Interquartile 25% (IQ1) | $46,765 | $68,829 |
| Interquartile 75% (IQ3) | $74,461 | $101,052 |
| Interquartile Range (IQR) | $27,696 | $32,223 |
| Standard Deviation (Sample) | $17,826 | $26,034 |
| Standard Deviation (Population) | $17,666 | $25,940 |
Similar Demographics by Median Male Earnings
Demographics Similar to Immigrants from Malaysia by Median Male Earnings
In terms of median male earnings, the demographic groups most similar to Immigrants from Malaysia are Immigrants from Austria ($62,164, a difference of 0.070%), Immigrants from Europe ($62,057, a difference of 0.10%), Immigrants from Czechoslovakia ($62,217, a difference of 0.15%), Bulgarian ($62,378, a difference of 0.41%), and Bhutanese ($61,759, a difference of 0.59%).
| Demographics | Rating | Rank | Median Male Earnings |
| Immigrants | Turkey | 100.0 /100 | #41 | Exceptional $62,728 |
| Immigrants | Greece | 100.0 /100 | #42 | Exceptional $62,689 |
| Immigrants | Belarus | 100.0 /100 | #43 | Exceptional $62,658 |
| Cambodians | 100.0 /100 | #44 | Exceptional $62,516 |
| Bulgarians | 100.0 /100 | #45 | Exceptional $62,378 |
| Immigrants | Czechoslovakia | 99.9 /100 | #46 | Exceptional $62,217 |
| Immigrants | Austria | 99.9 /100 | #47 | Exceptional $62,164 |
| Immigrants | Malaysia | 99.9 /100 | #48 | Exceptional $62,121 |
| Immigrants | Europe | 99.9 /100 | #49 | Exceptional $62,057 |
| Bhutanese | 99.9 /100 | #50 | Exceptional $61,759 |
| Estonians | 99.9 /100 | #51 | Exceptional $61,710 |
| Immigrants | Norway | 99.9 /100 | #52 | Exceptional $61,628 |
| South Africans | 99.9 /100 | #53 | Exceptional $61,460 |
| Immigrants | Latvia | 99.9 /100 | #54 | Exceptional $61,422 |
| Greeks | 99.9 /100 | #55 | Exceptional $61,242 |
Demographics Similar to Immigrants from South Central Asia by Median Male Earnings
In terms of median male earnings, the demographic groups most similar to Immigrants from South Central Asia are Immigrants from Israel ($68,716, a difference of 0.35%), Immigrants from Iran ($69,284, a difference of 0.47%), Immigrants from Hong Kong ($70,146, a difference of 1.7%), Immigrants from Ireland ($67,698, a difference of 1.9%), and Immigrants from Australia ($67,634, a difference of 2.0%).
| Demographics | Rating | Rank | Median Male Earnings |
| Immigrants | India | 100.0 /100 | #2 | Exceptional $74,207 |
| Immigrants | Taiwan | 100.0 /100 | #3 | Exceptional $74,031 |
| Thais | 100.0 /100 | #4 | Exceptional $72,135 |
| Immigrants | Singapore | 100.0 /100 | #5 | Exceptional $71,348 |
| Iranians | 100.0 /100 | #6 | Exceptional $70,648 |
| Immigrants | Hong Kong | 100.0 /100 | #7 | Exceptional $70,146 |
| Immigrants | Iran | 100.0 /100 | #8 | Exceptional $69,284 |
| Immigrants | South Central Asia | 100.0 /100 | #9 | Exceptional $68,960 |
| Immigrants | Israel | 100.0 /100 | #10 | Exceptional $68,716 |
| Immigrants | Ireland | 100.0 /100 | #11 | Exceptional $67,698 |
| Immigrants | Australia | 100.0 /100 | #12 | Exceptional $67,634 |
| Immigrants | China | 100.0 /100 | #13 | Exceptional $67,353 |
| Okinawans | 100.0 /100 | #14 | Exceptional $67,232 |
| Immigrants | Eastern Asia | 100.0 /100 | #15 | Exceptional $66,903 |
| Eastern Europeans | 100.0 /100 | #16 | Exceptional $66,472 |