Immigrants from Malaysia vs Immigrants from Ireland Householder Income Over 65 years

COMPARE

Immigrants from Malaysia
Race
Ancestry
AfghanAfricanAlaska NativeAlaskan AthabascanAlbanianAleutAlsatianAmericanApacheArabArapahoArgentineanArmenianAssyrian/Chaldean/SyriacAustralianAustrianBahamianBangladeshiBarbadianBasqueBelgianBelizeanBermudanBhutaneseBlackfeetBolivianBrazilianBritishBritish West IndianBulgarianBurmeseCajunCambodianCanadianCape VerdeanCarpatho RusynCelticCentral AmericanCentral American IndianCherokeeCheyenneChickasawChileanChineseChippewaChoctawColombianColvilleComancheCosta RicanCreeCreekCroatianCrowCubanCypriotCzechCzechoslovakianDanishDelawareDominicanDutchDutch West IndianEastern EuropeanEcuadorianEgyptianEnglishEstonianEthiopianEuropeanFijianFilipinoFinnishFrenchFrench American IndianFrench CanadianGermanGerman RussianGhanaianGreekGuamanian/ChamorroGuatemalanGuyaneseHaitianHmongHonduranHopiHoumaHungarianIcelanderIndian (Asian)IndonesianInupiatIranianIraqiIrishIroquoisIsraeliItalianJamaicanJapaneseJordanianKenyanKiowaKoreanLaotianLatvianLebaneseLiberianLithuanianLumbeeLuxembourgerMacedonianMalaysianMalteseMarshalleseMenomineeMexicanMexican American IndianMongolianMoroccanNative HawaiianNavajoNepaleseNew ZealanderNicaraguanNigerianNorthern EuropeanNorwegianOkinawanOsageOttawaPaiutePakistaniPalestinianPanamanianParaguayanPennsylvania GermanPeruvianPimaPolishPortuguesePotawatomiPuebloPuerto RicanPuget Sound SalishRomanianRussianSalvadoranSamoanScandinavianScotch-IrishScottishSeminoleSenegaleseSerbianShoshoneSierra LeoneanSiouxSlavicSlovakSloveneSomaliSouth AfricanSouth AmericanSouth American IndianSoviet UnionSpaniardSpanishSpanish AmericanSpanish American IndianSri LankanSubsaharan AfricanSudaneseSwedishSwissSyrianTaiwaneseThaiTlingit-HaidaTohono O'OdhamTonganTrinidadian and TobagonianTsimshianTurkishU.S. Virgin IslanderUgandanUkrainianUruguayanUteVenezuelanVietnameseWelshWest IndianYakamaYaquiYugoslavianYumanYup'ikZimbabwean
Immigration
NonimmigrantsImmigrantsAfghanistanAfricaAlbaniaArgentinaArmeniaAsiaAustraliaAustriaBahamasBangladeshBarbadosBelarusBelgiumBelizeBoliviaBosnia and HerzegovinaBrazilBulgariaBurma/MyanmarCabo VerdeCambodiaCameroonCanadaCaribbeanCentral AmericaChileChinaColombiaCongoCosta RicaCroatiaCubaCzechoslovakiaDenmarkDominicaDominican RepublicEastern AfricaEastern AsiaEastern EuropeEcuadorEgyptEl SalvadorEnglandEritreaEthiopiaEuropeFijiFranceGermanyGhanaGreeceGrenadaGuatemalaGuyanaHaitiHondurasHong KongHungaryIndiaIndonesiaIranIraqIsraelItalyJamaicaJapanJordanKazakhstanKenyaKoreaKuwaitLaosLatin AmericaLatviaLebanonLiberiaLithuaniaMalaysiaMexicoMicronesiaMiddle AfricaMoldovaMoroccoNepalNetherlandsNicaraguaNigeriaNorth AmericaNorth MacedoniaNorthern AfricaNorthern EuropeNorwayOceaniaPakistanPanamaPeruPhilippinesPolandPortugalRomaniaRussiaSaudi ArabiaScotlandSenegalSerbiaSierra LeoneSingaporeSomaliaSouth AfricaSouth AmericaSouth Central AsiaSouth Eastern AsiaSouthern EuropeSpainSri LankaSt. Vincent and the GrenadinesSudanSwedenSwitzerlandSyriaTaiwanThailandTrinidad and TobagoTurkeyUgandaUkraineUruguayUzbekistanVenezuelaVietnamWest IndiesWestern AfricaWestern AsiaWestern EuropeYemenZaireZimbabweAzores
Immigrants from Ireland
Race
Ancestry
AfghanAfricanAlaska NativeAlaskan AthabascanAlbanianAleutAlsatianAmericanApacheArabArapahoArgentineanArmenianAssyrian/Chaldean/SyriacAustralianAustrianBahamianBangladeshiBarbadianBasqueBelgianBelizeanBermudanBhutaneseBlackfeetBolivianBrazilianBritishBritish West IndianBulgarianBurmeseCajunCambodianCanadianCape VerdeanCarpatho RusynCelticCentral AmericanCentral American IndianCherokeeCheyenneChickasawChileanChineseChippewaChoctawColombianColvilleComancheCosta RicanCreeCreekCroatianCrowCubanCypriotCzechCzechoslovakianDanishDelawareDominicanDutchDutch West IndianEastern EuropeanEcuadorianEgyptianEnglishEstonianEthiopianEuropeanFijianFilipinoFinnishFrenchFrench American IndianFrench CanadianGermanGerman RussianGhanaianGreekGuamanian/ChamorroGuatemalanGuyaneseHaitianHmongHonduranHopiHoumaHungarianIcelanderIndian (Asian)IndonesianInupiatIranianIraqiIrishIroquoisIsraeliItalianJamaicanJapaneseJordanianKenyanKiowaKoreanLaotianLatvianLebaneseLiberianLithuanianLumbeeLuxembourgerMacedonianMalaysianMalteseMarshalleseMenomineeMexicanMexican American IndianMongolianMoroccanNative HawaiianNavajoNepaleseNew ZealanderNicaraguanNigerianNorthern EuropeanNorwegianOkinawanOsageOttawaPaiutePakistaniPalestinianPanamanianParaguayanPennsylvania GermanPeruvianPimaPolishPortuguesePotawatomiPuebloPuerto RicanPuget Sound SalishRomanianRussianSalvadoranSamoanScandinavianScotch-IrishScottishSeminoleSenegaleseSerbianShoshoneSierra LeoneanSiouxSlavicSlovakSloveneSomaliSouth AfricanSouth AmericanSouth American IndianSoviet UnionSpaniardSpanishSpanish AmericanSpanish American IndianSri LankanSubsaharan AfricanSudaneseSwedishSwissSyrianTaiwaneseThaiTlingit-HaidaTohono O'OdhamTonganTrinidadian and TobagonianTsimshianTurkishU.S. Virgin IslanderUgandanUkrainianUruguayanUteVenezuelanVietnameseWelshWest IndianYakamaYaquiYugoslavianYumanYup'ikZimbabwean
Immigration
NonimmigrantsImmigrantsAfghanistanAfricaAlbaniaArgentinaArmeniaAsiaAustraliaAustriaBahamasBangladeshBarbadosBelarusBelgiumBelizeBoliviaBosnia and HerzegovinaBrazilBulgariaBurma/MyanmarCabo VerdeCambodiaCameroonCanadaCaribbeanCentral AmericaChileChinaColombiaCongoCosta RicaCroatiaCubaCzechoslovakiaDenmarkDominicaDominican RepublicEastern AfricaEastern AsiaEastern EuropeEcuadorEgyptEl SalvadorEnglandEritreaEthiopiaEuropeFijiFranceGermanyGhanaGreeceGrenadaGuatemalaGuyanaHaitiHondurasHong KongHungaryIndiaIndonesiaIranIraqIrelandIsraelItalyJamaicaJapanJordanKazakhstanKenyaKoreaKuwaitLaosLatin AmericaLatviaLebanonLiberiaLithuaniaMexicoMicronesiaMiddle AfricaMoldovaMoroccoNepalNetherlandsNicaraguaNigeriaNorth AmericaNorth MacedoniaNorthern AfricaNorthern EuropeNorwayOceaniaPakistanPanamaPeruPhilippinesPolandPortugalRomaniaRussiaSaudi ArabiaScotlandSenegalSerbiaSierra LeoneSingaporeSomaliaSouth AfricaSouth AmericaSouth Central AsiaSouth Eastern AsiaSouthern EuropeSpainSri LankaSt. Vincent and the GrenadinesSudanSwedenSwitzerlandSyriaTaiwanThailandTrinidad and TobagoTurkeyUgandaUkraineUruguayUzbekistanVenezuelaVietnamWest IndiesWestern AfricaWestern AsiaWestern EuropeYemenZaireZimbabweAzores
Householder Income Over 65 years
Income
Poverty
Unemployment
Labor Participation
Family Structure
Vehicle Availability
Education Level
Disability

Householder Income Over 65 years Comparison

Immigrants from Malaysia

Immigrants from Ireland

Exceptional
Exceptional
$65,497
HOUSEHOLDER INCOME OVER 65 YEARS
99.1/ 100
METRIC RATING
67th/ 347
METRIC RANK
$68,495
HOUSEHOLDER INCOME OVER 65 YEARS
100.0/ 100
METRIC RATING
34th/ 347
METRIC RANK

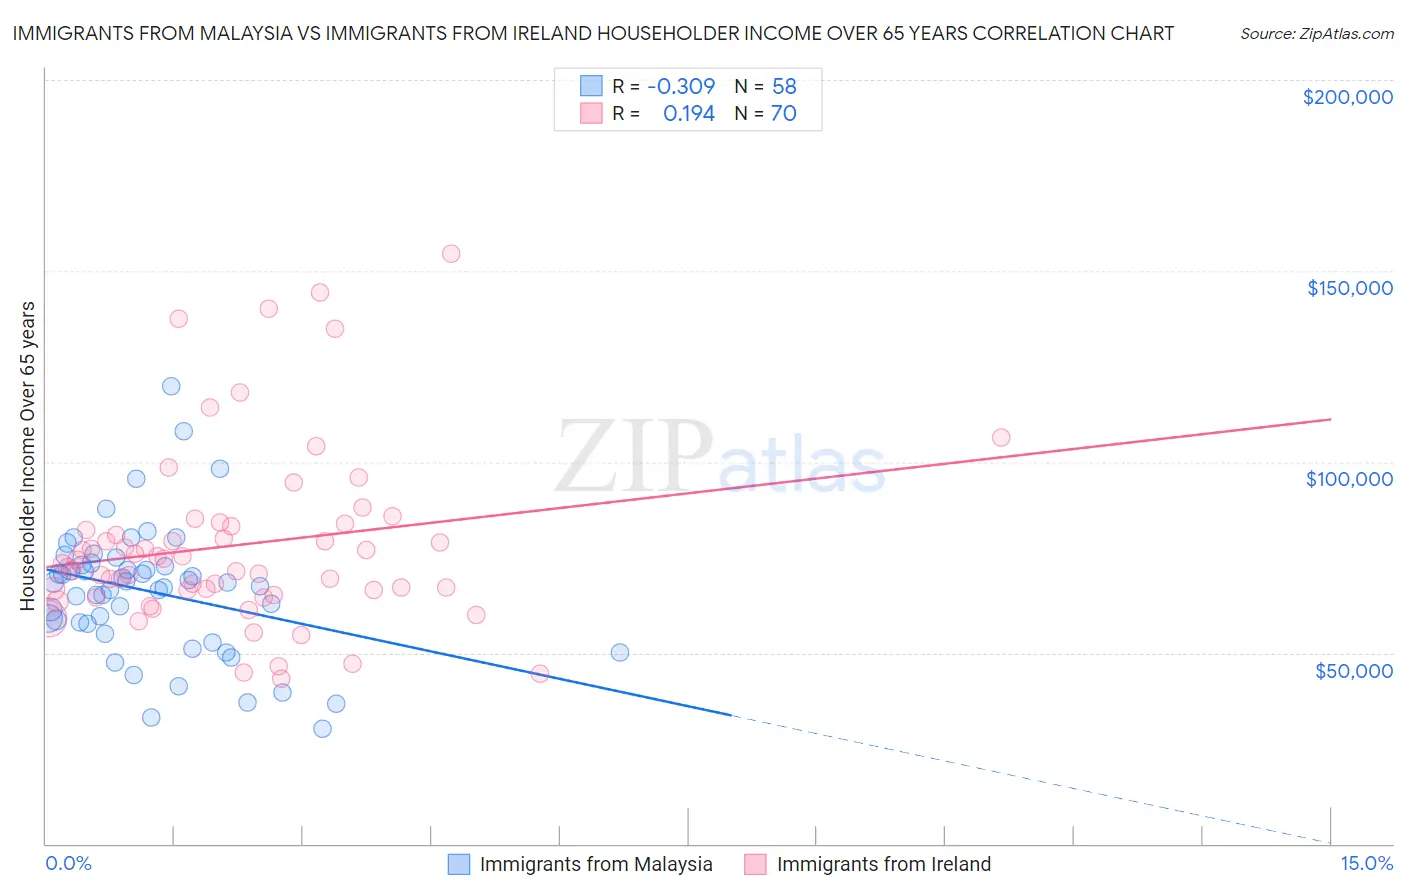
Immigrants from Malaysia vs Immigrants from Ireland Householder Income Over 65 years Correlation Chart

The statistical analysis conducted on geographies consisting of 197,759,945 people shows a mild negative correlation between the proportion of Immigrants from Malaysia and household income with householder over the age of 65 in the United States with a correlation coefficient (R) of -0.309 and weighted average of $65,497. Similarly, the statistical analysis conducted on geographies consisting of 240,465,056 people shows a poor positive correlation between the proportion of Immigrants from Ireland and household income with householder over the age of 65 in the United States with a correlation coefficient (R) of 0.194 and weighted average of $68,495, a difference of 4.6%.
Immigrants from Malaysia vs Immigrants from Ireland Householder Income Over 65 years

Householder Income Over 65 years Correlation Summary

MeasurementImmigrants from MalaysiaImmigrants from Ireland
Minimum$30,000$43,125
Maximum$119,688$154,545
Range$89,688$111,420
Mean$65,996$78,195
Median$67,851$73,743
Interquartile 25% (IQ1)$57,508$66,428
Interquartile 75% (IQ3)$73,101$83,026
Interquartile Range (IQR)$15,593$16,598
Standard Deviation (Sample)$17,025$23,254
Standard Deviation (Population)$16,878$23,087

Similar Demographics by Householder Income Over 65 years

Demographics Similar to Immigrants from Malaysia by Householder Income Over 65 years

In terms of householder income over 65 years, the demographic groups most similar to Immigrants from Malaysia are Egyptian ($65,441, a difference of 0.090%), Samoan ($65,427, a difference of 0.11%), South African ($65,652, a difference of 0.24%), Mongolian ($65,326, a difference of 0.26%), and Greek ($65,306, a difference of 0.29%).
DemographicsRating | RankHouseholder Income Over 65 years
Immigrants | Lithuania
99.5
/100
|
#60
Exceptional
$66,087
Maltese
99.5
/100
|
#61
Exceptional
$66,027
Immigrants | Sierra Leone
99.5
/100
|
#62
Exceptional
$66,009
Marshallese
99.4
/100
|
#63
Exceptional
$65,874
Zimbabweans
99.4
/100
|
#64
Exceptional
$65,854
Immigrants | England
99.3
/100
|
#65
Exceptional
$65,715
South Africans
99.3
/100
|
#66
Exceptional
$65,652
Immigrants | Malaysia
99.1
/100
|
#67
Exceptional
$65,497
Egyptians
99.1
/100
|
#68
Exceptional
$65,441
Samoans
99.1
/100
|
#69
Exceptional
$65,427
Mongolians
99.0
/100
|
#70
Exceptional
$65,326
Greeks
98.9
/100
|
#71
Exceptional
$65,306
Argentineans
98.9
/100
|
#72
Exceptional
$65,246
Immigrants | Ethiopia
98.9
/100
|
#73
Exceptional
$65,238
Lithuanians
98.8
/100
|
#74
Exceptional
$65,209

Demographics Similar to Immigrants from Ireland by Householder Income Over 65 years

In terms of householder income over 65 years, the demographic groups most similar to Immigrants from Ireland are Tongan ($68,235, a difference of 0.38%), Immigrants from Austria ($68,208, a difference of 0.42%), Immigrants from Denmark ($68,801, a difference of 0.45%), Asian ($68,822, a difference of 0.48%), and Afghan ($68,951, a difference of 0.67%).
DemographicsRating | RankHouseholder Income Over 65 years
Immigrants | Switzerland
100.0
/100
|
#27
Exceptional
$69,343
Immigrants | China
100.0
/100
|
#28
Exceptional
$69,174
Immigrants | Australia
100.0
/100
|
#29
Exceptional
$69,164
Immigrants | Northern Europe
100.0
/100
|
#30
Exceptional
$69,003
Afghans
100.0
/100
|
#31
Exceptional
$68,951
Asians
100.0
/100
|
#32
Exceptional
$68,822
Immigrants | Denmark
100.0
/100
|
#33
Exceptional
$68,801
Immigrants | Ireland
100.0
/100
|
#34
Exceptional
$68,495
Tongans
100.0
/100
|
#35
Exceptional
$68,235
Immigrants | Austria
99.9
/100
|
#36
Exceptional
$68,208
Turks
99.9
/100
|
#37
Exceptional
$68,037
Estonians
99.9
/100
|
#38
Exceptional
$67,926
Russians
99.9
/100
|
#39
Exceptional
$67,626
Immigrants | Asia
99.9
/100
|
#40
Exceptional
$67,594
Koreans
99.9
/100
|
#41
Exceptional
$67,472