Immigrants from Liberia vs Pakistani Median Earnings
COMPARE
Immigrants from Liberia
Pakistani
Median Earnings
Median Earnings Comparison
Immigrants from Liberia
Pakistanis
$42,923
MEDIAN EARNINGS
0.7/ 100
METRIC RATING
264th/ 347
METRIC RANK
$48,254
MEDIAN EARNINGS
92.8/ 100
METRIC RATING
129th/ 347
METRIC RANK
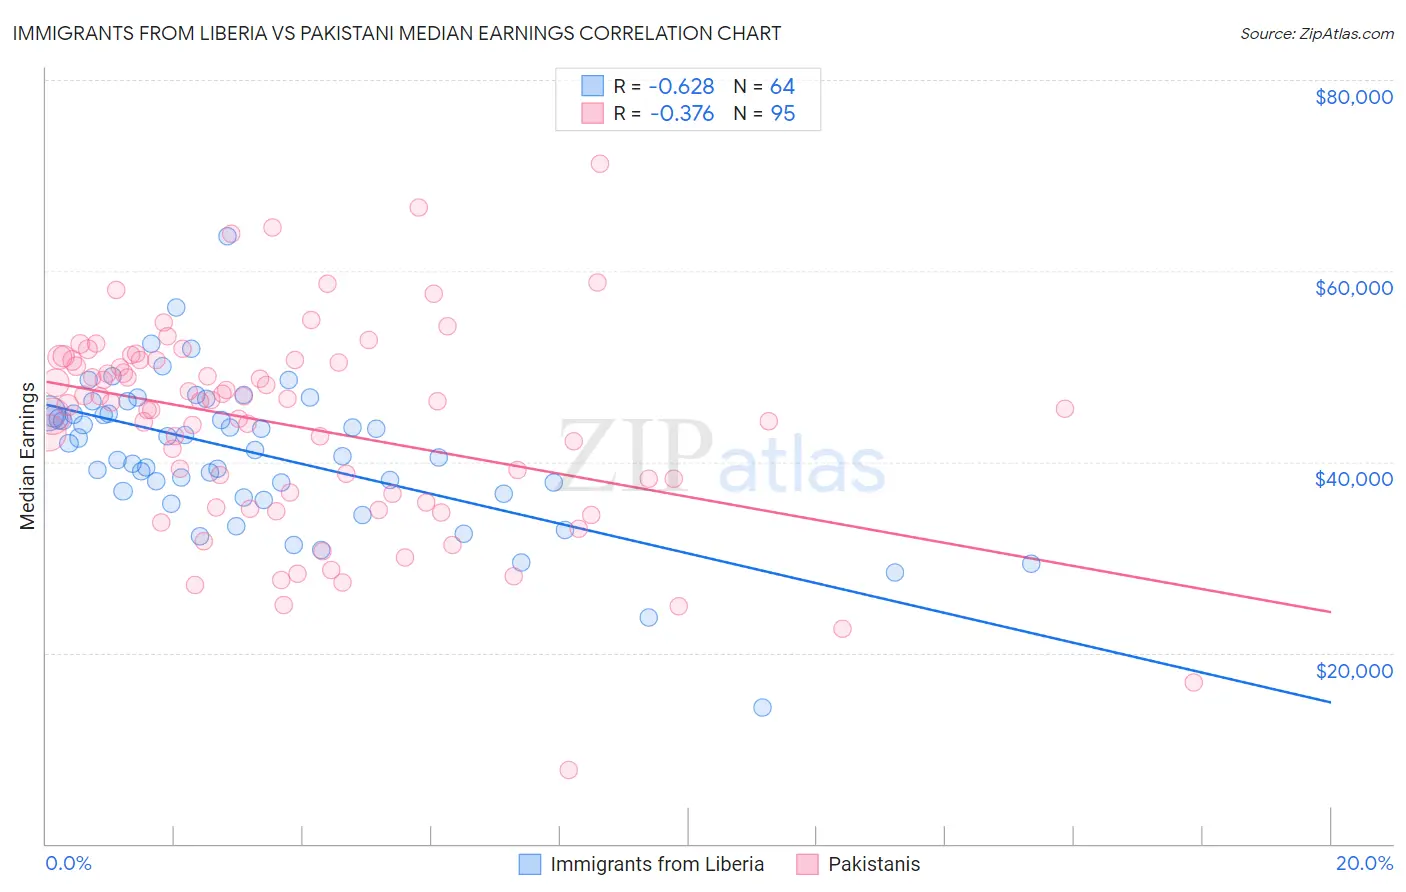
Immigrants from Liberia vs Pakistani Median Earnings Correlation Chart
The statistical analysis conducted on geographies consisting of 135,295,960 people shows a significant negative correlation between the proportion of Immigrants from Liberia and median earnings in the United States with a correlation coefficient (R) of -0.628 and weighted average of $42,923. Similarly, the statistical analysis conducted on geographies consisting of 335,344,487 people shows a mild negative correlation between the proportion of Pakistanis and median earnings in the United States with a correlation coefficient (R) of -0.376 and weighted average of $48,254, a difference of 12.4%.
Median Earnings Correlation Summary
| Measurement | Immigrants from Liberia | Pakistani |
| Minimum | $14,336 | $7,703 |
| Maximum | $63,608 | $71,250 |
| Range | $49,272 | $63,547 |
| Mean | $40,857 | $43,723 |
| Median | $41,575 | $46,169 |
| Interquartile 25% (IQ1) | $36,787 | $35,714 |
| Interquartile 75% (IQ3) | $45,056 | $50,670 |
| Interquartile Range (IQR) | $8,269 | $14,956 |
| Standard Deviation (Sample) | $7,722 | $10,826 |
| Standard Deviation (Population) | $7,661 | $10,769 |
Similar Demographics by Median Earnings
Demographics Similar to Immigrants from Liberia by Median Earnings
In terms of median earnings, the demographic groups most similar to Immigrants from Liberia are Salvadoran ($42,912, a difference of 0.030%), Immigrants from Laos ($42,884, a difference of 0.090%), Inupiat ($43,000, a difference of 0.18%), Immigrants from Jamaica ($43,026, a difference of 0.24%), and Nicaraguan ($43,026, a difference of 0.24%).
| Demographics | Rating | Rank | Median Earnings |
| Jamaicans | 1.3 /100 | #257 | Tragic $43,343 |
| French American Indians | 1.3 /100 | #258 | Tragic $43,333 |
| German Russians | 1.1 /100 | #259 | Tragic $43,200 |
| Immigrants | Somalia | 0.9 /100 | #260 | Tragic $43,100 |
| Immigrants | Jamaica | 0.8 /100 | #261 | Tragic $43,026 |
| Nicaraguans | 0.8 /100 | #262 | Tragic $43,026 |
| Inupiat | 0.8 /100 | #263 | Tragic $43,000 |
| Immigrants | Liberia | 0.7 /100 | #264 | Tragic $42,923 |
| Salvadorans | 0.7 /100 | #265 | Tragic $42,912 |
| Immigrants | Laos | 0.7 /100 | #266 | Tragic $42,884 |
| Cree | 0.6 /100 | #267 | Tragic $42,777 |
| Americans | 0.6 /100 | #268 | Tragic $42,742 |
| Belizeans | 0.5 /100 | #269 | Tragic $42,702 |
| Osage | 0.5 /100 | #270 | Tragic $42,651 |
| Pennsylvania Germans | 0.5 /100 | #271 | Tragic $42,615 |
Demographics Similar to Pakistanis by Median Earnings
In terms of median earnings, the demographic groups most similar to Pakistanis are Immigrants from Philippines ($48,266, a difference of 0.020%), Zimbabwean ($48,229, a difference of 0.050%), Lebanese ($48,226, a difference of 0.060%), Sierra Leonean ($48,286, a difference of 0.070%), and Assyrian/Chaldean/Syriac ($48,304, a difference of 0.10%).
| Demographics | Rating | Rank | Median Earnings |
| Chileans | 94.8 /100 | #122 | Exceptional $48,504 |
| Immigrants | Syria | 93.9 /100 | #123 | Exceptional $48,375 |
| Brazilians | 93.7 /100 | #124 | Exceptional $48,356 |
| Immigrants | Fiji | 93.3 /100 | #125 | Exceptional $48,305 |
| Assyrians/Chaldeans/Syriacs | 93.3 /100 | #126 | Exceptional $48,304 |
| Sierra Leoneans | 93.1 /100 | #127 | Exceptional $48,286 |
| Immigrants | Philippines | 92.9 /100 | #128 | Exceptional $48,266 |
| Pakistanis | 92.8 /100 | #129 | Exceptional $48,254 |
| Zimbabweans | 92.6 /100 | #130 | Exceptional $48,229 |
| Lebanese | 92.5 /100 | #131 | Exceptional $48,226 |
| British | 92.2 /100 | #132 | Exceptional $48,189 |
| Immigrants | Uganda | 90.5 /100 | #133 | Exceptional $48,041 |
| Sri Lankans | 90.5 /100 | #134 | Exceptional $48,040 |
| Portuguese | 90.4 /100 | #135 | Exceptional $48,032 |
| Slovenes | 90.0 /100 | #136 | Excellent $47,995 |