Immigrants from Lebanon vs Choctaw Median Earnings
COMPARE
Immigrants from Lebanon
Choctaw
Median Earnings
Median Earnings Comparison
Immigrants from Lebanon
Choctaw
$49,682
MEDIAN EARNINGS
99.0/ 100
METRIC RATING
96th/ 347
METRIC RANK
$40,270
MEDIAN EARNINGS
0.0/ 100
METRIC RATING
313th/ 347
METRIC RANK
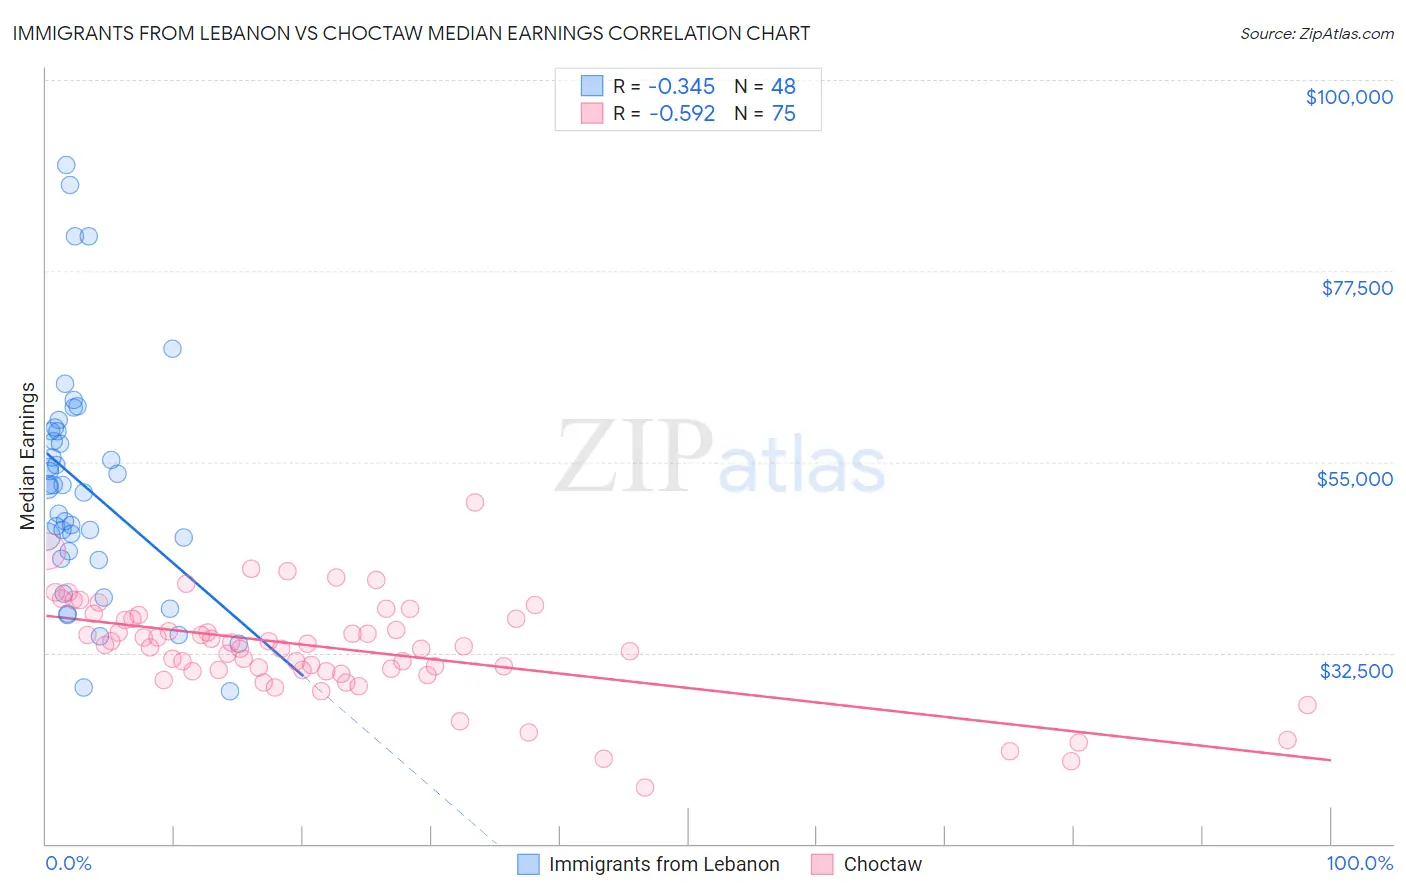
Immigrants from Lebanon vs Choctaw Median Earnings Correlation Chart
The statistical analysis conducted on geographies consisting of 217,150,005 people shows a mild negative correlation between the proportion of Immigrants from Lebanon and median earnings in the United States with a correlation coefficient (R) of -0.345 and weighted average of $49,682. Similarly, the statistical analysis conducted on geographies consisting of 269,709,236 people shows a substantial negative correlation between the proportion of Choctaw and median earnings in the United States with a correlation coefficient (R) of -0.592 and weighted average of $40,270, a difference of 23.4%.
Median Earnings Correlation Summary
| Measurement | Immigrants from Lebanon | Choctaw |
| Minimum | $27,932 | $16,607 |
| Maximum | $89,953 | $50,240 |
| Range | $62,021 | $33,633 |
| Mean | $52,128 | $33,003 |
| Median | $52,076 | $33,256 |
| Interquartile 25% (IQ1) | $44,033 | $30,391 |
| Interquartile 75% (IQ3) | $58,565 | $36,563 |
| Interquartile Range (IQR) | $14,532 | $6,172 |
| Standard Deviation (Sample) | $13,798 | $5,920 |
| Standard Deviation (Population) | $13,653 | $5,880 |
Similar Demographics by Median Earnings
Demographics Similar to Immigrants from Lebanon by Median Earnings
In terms of median earnings, the demographic groups most similar to Immigrants from Lebanon are Immigrants from North Macedonia ($49,658, a difference of 0.050%), Immigrants from Northern Africa ($49,648, a difference of 0.070%), Immigrants from Afghanistan ($49,645, a difference of 0.070%), Immigrants from England ($49,722, a difference of 0.080%), and Croatian ($49,724, a difference of 0.090%).
| Demographics | Rating | Rank | Median Earnings |
| Immigrants | North America | 99.4 /100 | #89 | Exceptional $50,108 |
| Italians | 99.3 /100 | #90 | Exceptional $49,915 |
| Macedonians | 99.2 /100 | #91 | Exceptional $49,893 |
| Immigrants | Argentina | 99.2 /100 | #92 | Exceptional $49,841 |
| Armenians | 99.1 /100 | #93 | Exceptional $49,804 |
| Croatians | 99.0 /100 | #94 | Exceptional $49,724 |
| Immigrants | England | 99.0 /100 | #95 | Exceptional $49,722 |
| Immigrants | Lebanon | 99.0 /100 | #96 | Exceptional $49,682 |
| Immigrants | North Macedonia | 98.9 /100 | #97 | Exceptional $49,658 |
| Immigrants | Northern Africa | 98.9 /100 | #98 | Exceptional $49,648 |
| Immigrants | Afghanistan | 98.9 /100 | #99 | Exceptional $49,645 |
| Immigrants | Poland | 98.9 /100 | #100 | Exceptional $49,633 |
| Jordanians | 98.9 /100 | #101 | Exceptional $49,632 |
| Ethiopians | 98.8 /100 | #102 | Exceptional $49,572 |
| Austrians | 98.7 /100 | #103 | Exceptional $49,501 |
Demographics Similar to Choctaw by Median Earnings
In terms of median earnings, the demographic groups most similar to Choctaw are Hispanic or Latino ($40,288, a difference of 0.040%), Chippewa ($40,287, a difference of 0.040%), Cheyenne ($40,233, a difference of 0.090%), Seminole ($40,233, a difference of 0.090%), and Immigrants from Honduras ($40,195, a difference of 0.19%).
| Demographics | Rating | Rank | Median Earnings |
| Yaqui | 0.0 /100 | #306 | Tragic $40,647 |
| Hondurans | 0.0 /100 | #307 | Tragic $40,638 |
| Cubans | 0.0 /100 | #308 | Tragic $40,619 |
| Immigrants | Haiti | 0.0 /100 | #309 | Tragic $40,550 |
| Apache | 0.0 /100 | #310 | Tragic $40,388 |
| Hispanics or Latinos | 0.0 /100 | #311 | Tragic $40,288 |
| Chippewa | 0.0 /100 | #312 | Tragic $40,287 |
| Choctaw | 0.0 /100 | #313 | Tragic $40,270 |
| Cheyenne | 0.0 /100 | #314 | Tragic $40,233 |
| Seminole | 0.0 /100 | #315 | Tragic $40,233 |
| Immigrants | Honduras | 0.0 /100 | #316 | Tragic $40,195 |
| Fijians | 0.0 /100 | #317 | Tragic $40,193 |
| Dutch West Indians | 0.0 /100 | #318 | Tragic $40,107 |
| Blacks/African Americans | 0.0 /100 | #319 | Tragic $40,085 |
| Immigrants | Bahamas | 0.0 /100 | #320 | Tragic $39,861 |