Immigrants from Laos vs Burmese Householder Income Ages 25 - 44 years
COMPARE
Immigrants from Laos
Burmese
Householder Income Ages 25 - 44 years
Householder Income Ages 25 - 44 years Comparison
Immigrants from Laos
Burmese
$85,553
HOUSEHOLDER INCOME AGES 25 - 44 YEARS
0.7/ 100
METRIC RATING
254th/ 347
METRIC RANK
$113,701
HOUSEHOLDER INCOME AGES 25 - 44 YEARS
100.0/ 100
METRIC RATING
19th/ 347
METRIC RANK
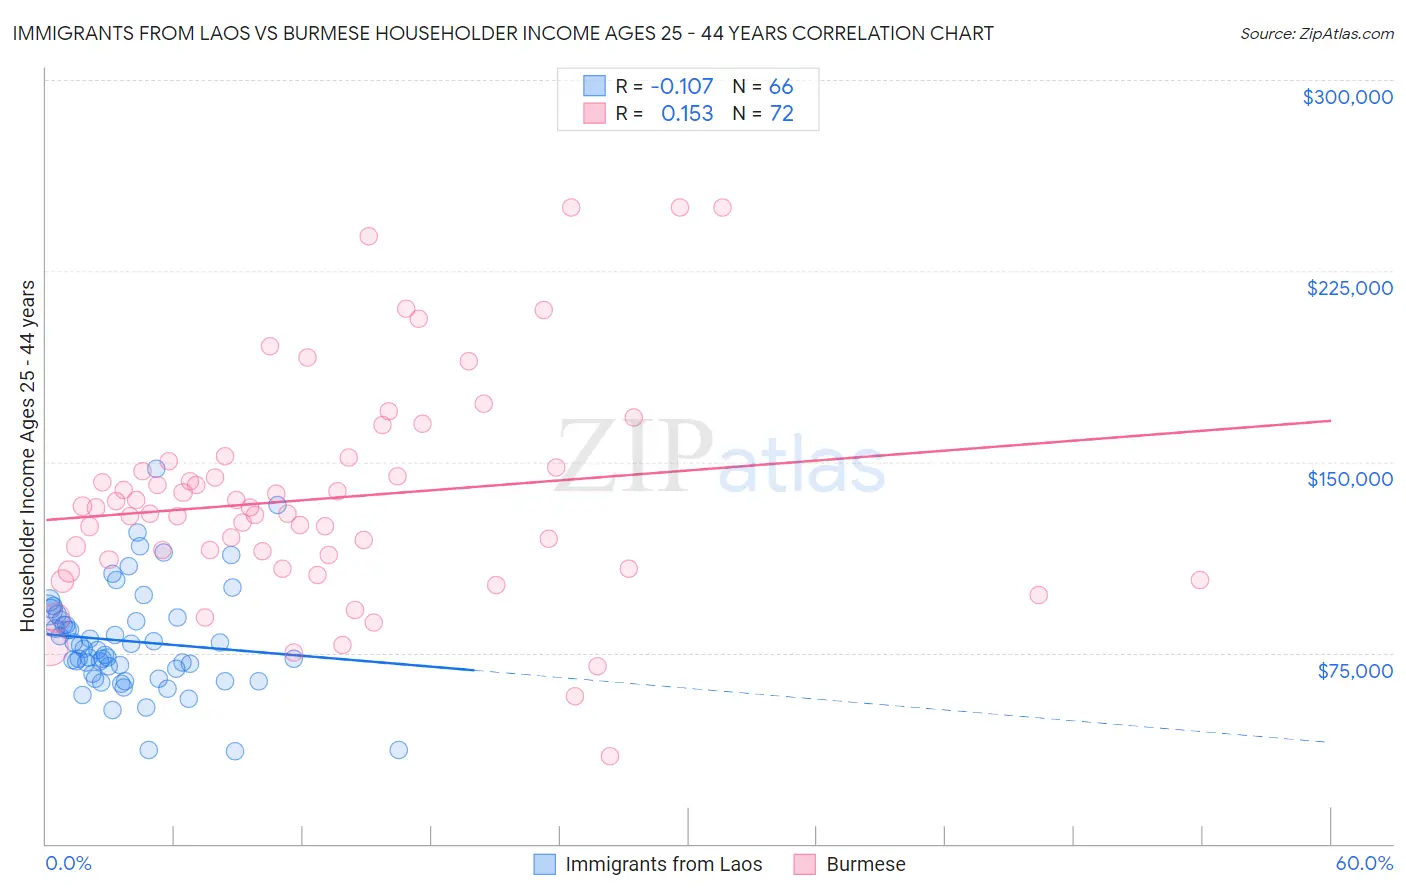
Immigrants from Laos vs Burmese Householder Income Ages 25 - 44 years Correlation Chart
The statistical analysis conducted on geographies consisting of 201,332,387 people shows a poor negative correlation between the proportion of Immigrants from Laos and household income with householder between the ages 25 and 44 in the United States with a correlation coefficient (R) of -0.107 and weighted average of $85,553. Similarly, the statistical analysis conducted on geographies consisting of 463,720,285 people shows a poor positive correlation between the proportion of Burmese and household income with householder between the ages 25 and 44 in the United States with a correlation coefficient (R) of 0.153 and weighted average of $113,701, a difference of 32.9%.
Householder Income Ages 25 - 44 years Correlation Summary
| Measurement | Immigrants from Laos | Burmese |
| Minimum | $36,106 | $34,375 |
| Maximum | $147,348 | $250,001 |
| Range | $111,242 | $215,626 |
| Mean | $79,556 | $135,614 |
| Median | $76,403 | $130,767 |
| Interquartile 25% (IQ1) | $66,885 | $109,816 |
| Interquartile 75% (IQ3) | $88,750 | $149,069 |
| Interquartile Range (IQR) | $21,865 | $39,253 |
| Standard Deviation (Sample) | $21,017 | $43,392 |
| Standard Deviation (Population) | $20,857 | $43,090 |
Similar Demographics by Householder Income Ages 25 - 44 years
Demographics Similar to Immigrants from Laos by Householder Income Ages 25 - 44 years
In terms of householder income ages 25 - 44 years, the demographic groups most similar to Immigrants from Laos are British West Indian ($85,565, a difference of 0.010%), Immigrants from Western Africa ($85,676, a difference of 0.14%), Cape Verdean ($85,758, a difference of 0.24%), Pennsylvania German ($85,836, a difference of 0.33%), and German Russian ($85,220, a difference of 0.39%).
| Demographics | Rating | Rank | Householder Income Ages 25 - 44 years |
| Immigrants | Nigeria | 1.2 /100 | #247 | Tragic $86,589 |
| Immigrants | Sudan | 0.9 /100 | #248 | Tragic $86,109 |
| French American Indians | 0.8 /100 | #249 | Tragic $85,899 |
| Pennsylvania Germans | 0.8 /100 | #250 | Tragic $85,836 |
| Cape Verdeans | 0.8 /100 | #251 | Tragic $85,758 |
| Immigrants | Western Africa | 0.7 /100 | #252 | Tragic $85,676 |
| British West Indians | 0.7 /100 | #253 | Tragic $85,565 |
| Immigrants | Laos | 0.7 /100 | #254 | Tragic $85,553 |
| German Russians | 0.6 /100 | #255 | Tragic $85,220 |
| Central Americans | 0.5 /100 | #256 | Tragic $85,144 |
| Mexican American Indians | 0.5 /100 | #257 | Tragic $85,066 |
| Immigrants | Nicaragua | 0.5 /100 | #258 | Tragic $84,914 |
| Immigrants | Senegal | 0.5 /100 | #259 | Tragic $84,848 |
| Americans | 0.4 /100 | #260 | Tragic $84,791 |
| Inupiat | 0.4 /100 | #261 | Tragic $84,619 |
Demographics Similar to Burmese by Householder Income Ages 25 - 44 years
In terms of householder income ages 25 - 44 years, the demographic groups most similar to Burmese are Immigrants from Korea ($113,401, a difference of 0.26%), Eastern European ($114,523, a difference of 0.72%), Asian ($112,666, a difference of 0.92%), Immigrants from Belgium ($112,575, a difference of 1.0%), and Immigrants from Japan ($112,228, a difference of 1.3%).
| Demographics | Rating | Rank | Householder Income Ages 25 - 44 years |
| Immigrants | Iran | 100.0 /100 | #12 | Exceptional $119,204 |
| Immigrants | Eastern Asia | 100.0 /100 | #13 | Exceptional $118,056 |
| Immigrants | Israel | 100.0 /100 | #14 | Exceptional $117,219 |
| Immigrants | South Central Asia | 100.0 /100 | #15 | Exceptional $116,626 |
| Cypriots | 100.0 /100 | #16 | Exceptional $116,364 |
| Immigrants | Australia | 100.0 /100 | #17 | Exceptional $115,947 |
| Eastern Europeans | 100.0 /100 | #18 | Exceptional $114,523 |
| Burmese | 100.0 /100 | #19 | Exceptional $113,701 |
| Immigrants | Korea | 100.0 /100 | #20 | Exceptional $113,401 |
| Asians | 100.0 /100 | #21 | Exceptional $112,666 |
| Immigrants | Belgium | 100.0 /100 | #22 | Exceptional $112,575 |
| Immigrants | Japan | 100.0 /100 | #23 | Exceptional $112,228 |
| Immigrants | Sweden | 100.0 /100 | #24 | Exceptional $112,010 |
| Immigrants | Northern Europe | 100.0 /100 | #25 | Exceptional $111,676 |
| Immigrants | Asia | 100.0 /100 | #26 | Exceptional $110,787 |