Immigrants from Kuwait vs Immigrants from Trinidad and Tobago Householder Income Ages 25 - 44 years
COMPARE
Immigrants from Kuwait
Immigrants from Trinidad and Tobago
Householder Income Ages 25 - 44 years
Householder Income Ages 25 - 44 years Comparison
Immigrants from Kuwait
Immigrants from Trinidad and Tobago
$98,122
HOUSEHOLDER INCOME AGES 25 - 44 YEARS
87.8/ 100
METRIC RATING
130th/ 347
METRIC RANK
$89,748
HOUSEHOLDER INCOME AGES 25 - 44 YEARS
6.5/ 100
METRIC RATING
221st/ 347
METRIC RANK
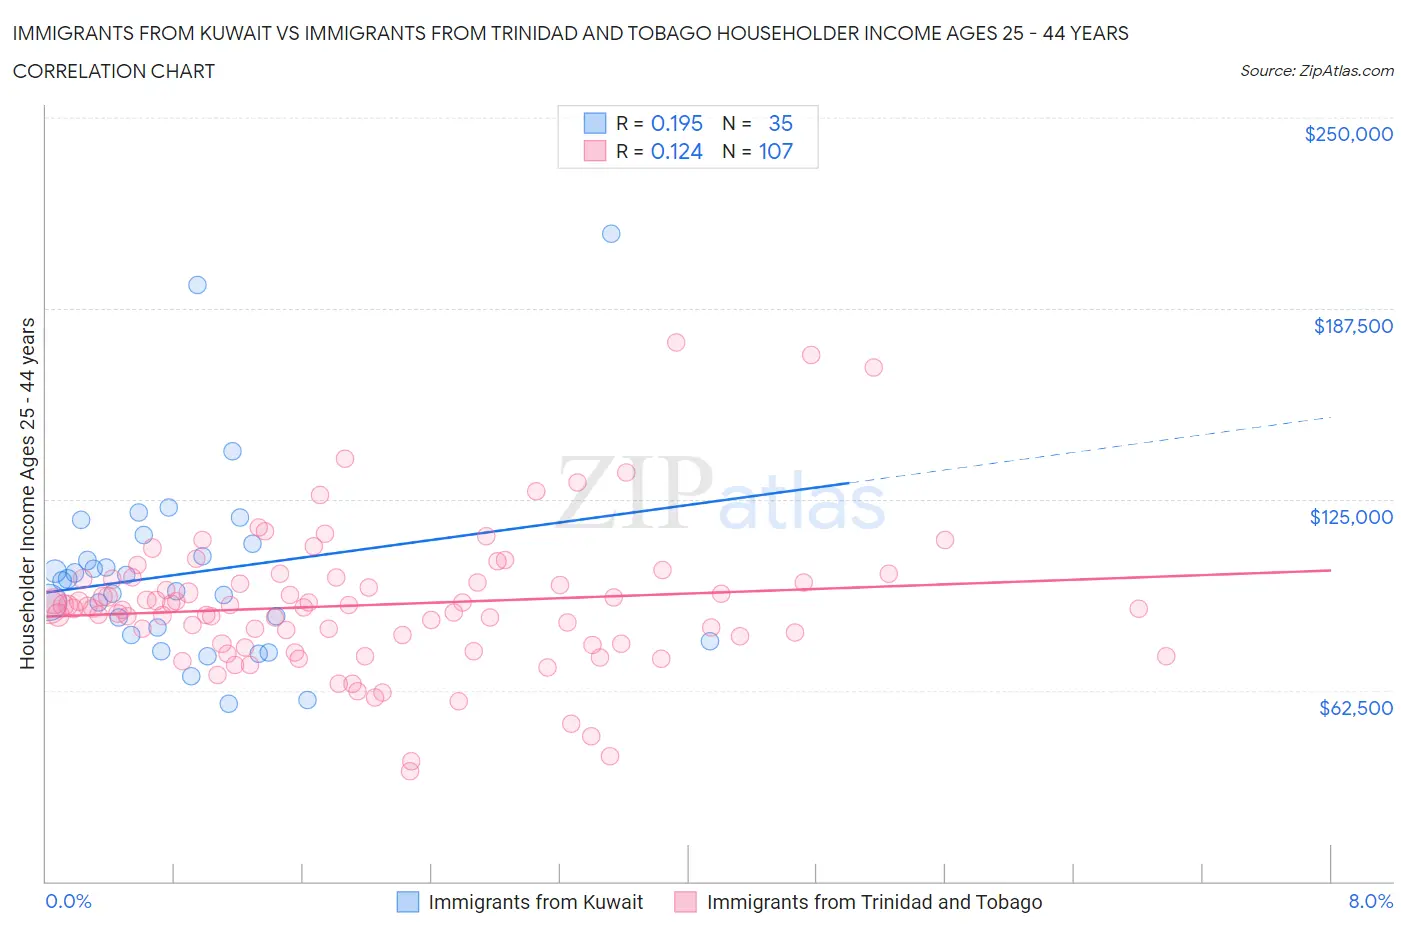
Immigrants from Kuwait vs Immigrants from Trinidad and Tobago Householder Income Ages 25 - 44 years Correlation Chart
The statistical analysis conducted on geographies consisting of 136,849,136 people shows a poor positive correlation between the proportion of Immigrants from Kuwait and household income with householder between the ages 25 and 44 in the United States with a correlation coefficient (R) of 0.195 and weighted average of $98,122. Similarly, the statistical analysis conducted on geographies consisting of 223,299,534 people shows a poor positive correlation between the proportion of Immigrants from Trinidad and Tobago and household income with householder between the ages 25 and 44 in the United States with a correlation coefficient (R) of 0.124 and weighted average of $89,748, a difference of 9.3%.
Householder Income Ages 25 - 44 years Correlation Summary
| Measurement | Immigrants from Kuwait | Immigrants from Trinidad and Tobago |
| Minimum | $58,000 | $35,919 |
| Maximum | $211,833 | $176,250 |
| Range | $153,833 | $140,331 |
| Mean | $100,890 | $90,423 |
| Median | $98,273 | $89,618 |
| Interquartile 25% (IQ1) | $80,635 | $77,590 |
| Interquartile 75% (IQ3) | $110,365 | $98,814 |
| Interquartile Range (IQR) | $29,730 | $21,224 |
| Standard Deviation (Sample) | $31,630 | $23,047 |
| Standard Deviation (Population) | $31,175 | $22,939 |
Similar Demographics by Householder Income Ages 25 - 44 years
Demographics Similar to Immigrants from Kuwait by Householder Income Ages 25 - 44 years
In terms of householder income ages 25 - 44 years, the demographic groups most similar to Immigrants from Kuwait are Brazilian ($98,267, a difference of 0.15%), European ($98,310, a difference of 0.19%), Serbian ($98,320, a difference of 0.20%), Immigrants from Albania ($97,929, a difference of 0.20%), and British ($98,359, a difference of 0.24%).
| Demographics | Rating | Rank | Householder Income Ages 25 - 44 years |
| Palestinians | 91.2 /100 | #123 | Exceptional $98,777 |
| Zimbabweans | 90.3 /100 | #124 | Exceptional $98,586 |
| Pakistanis | 89.3 /100 | #125 | Excellent $98,401 |
| British | 89.1 /100 | #126 | Excellent $98,359 |
| Serbians | 88.9 /100 | #127 | Excellent $98,320 |
| Europeans | 88.9 /100 | #128 | Excellent $98,310 |
| Brazilians | 88.6 /100 | #129 | Excellent $98,267 |
| Immigrants | Kuwait | 87.8 /100 | #130 | Excellent $98,122 |
| Immigrants | Albania | 86.6 /100 | #131 | Excellent $97,929 |
| Immigrants | Zimbabwe | 86.3 /100 | #132 | Excellent $97,880 |
| Tsimshian | 85.8 /100 | #133 | Excellent $97,809 |
| Canadians | 84.5 /100 | #134 | Excellent $97,625 |
| Immigrants | Oceania | 84.5 /100 | #135 | Excellent $97,623 |
| Hungarians | 83.9 /100 | #136 | Excellent $97,544 |
| Lebanese | 82.3 /100 | #137 | Excellent $97,339 |
Demographics Similar to Immigrants from Trinidad and Tobago by Householder Income Ages 25 - 44 years
In terms of householder income ages 25 - 44 years, the demographic groups most similar to Immigrants from Trinidad and Tobago are Immigrants from Ecuador ($89,673, a difference of 0.080%), Trinidadian and Tobagonian ($89,856, a difference of 0.12%), Delaware ($89,876, a difference of 0.14%), Immigrants from Guyana ($89,586, a difference of 0.18%), and Barbadian ($89,565, a difference of 0.20%).
| Demographics | Rating | Rank | Householder Income Ages 25 - 44 years |
| Immigrants | Africa | 8.9 /100 | #214 | Tragic $90,372 |
| Panamanians | 8.1 /100 | #215 | Tragic $90,193 |
| Ghanaians | 7.9 /100 | #216 | Tragic $90,137 |
| Scotch-Irish | 7.3 /100 | #217 | Tragic $89,969 |
| Guyanese | 7.1 /100 | #218 | Tragic $89,940 |
| Delaware | 6.9 /100 | #219 | Tragic $89,876 |
| Trinidadians and Tobagonians | 6.8 /100 | #220 | Tragic $89,856 |
| Immigrants | Trinidad and Tobago | 6.5 /100 | #221 | Tragic $89,748 |
| Immigrants | Ecuador | 6.2 /100 | #222 | Tragic $89,673 |
| Immigrants | Guyana | 5.9 /100 | #223 | Tragic $89,586 |
| Barbadians | 5.9 /100 | #224 | Tragic $89,565 |
| Immigrants | Panama | 5.5 /100 | #225 | Tragic $89,451 |
| Immigrants | Iraq | 5.5 /100 | #226 | Tragic $89,444 |
| Immigrants | St. Vincent and the Grenadines | 4.1 /100 | #227 | Tragic $88,888 |
| Immigrants | Bosnia and Herzegovina | 4.0 /100 | #228 | Tragic $88,819 |