Immigrants from Kuwait vs Immigrants from Eastern Africa Householder Income Over 65 years
COMPARE
Immigrants from Kuwait
Immigrants from Eastern Africa
Householder Income Over 65 years
Householder Income Over 65 years Comparison
Immigrants from Kuwait
Immigrants from Eastern Africa
$64,433
HOUSEHOLDER INCOME OVER 65 YEARS
97.4/ 100
METRIC RATING
90th/ 347
METRIC RANK
$61,157
HOUSEHOLDER INCOME OVER 65 YEARS
55.0/ 100
METRIC RATING
166th/ 347
METRIC RANK
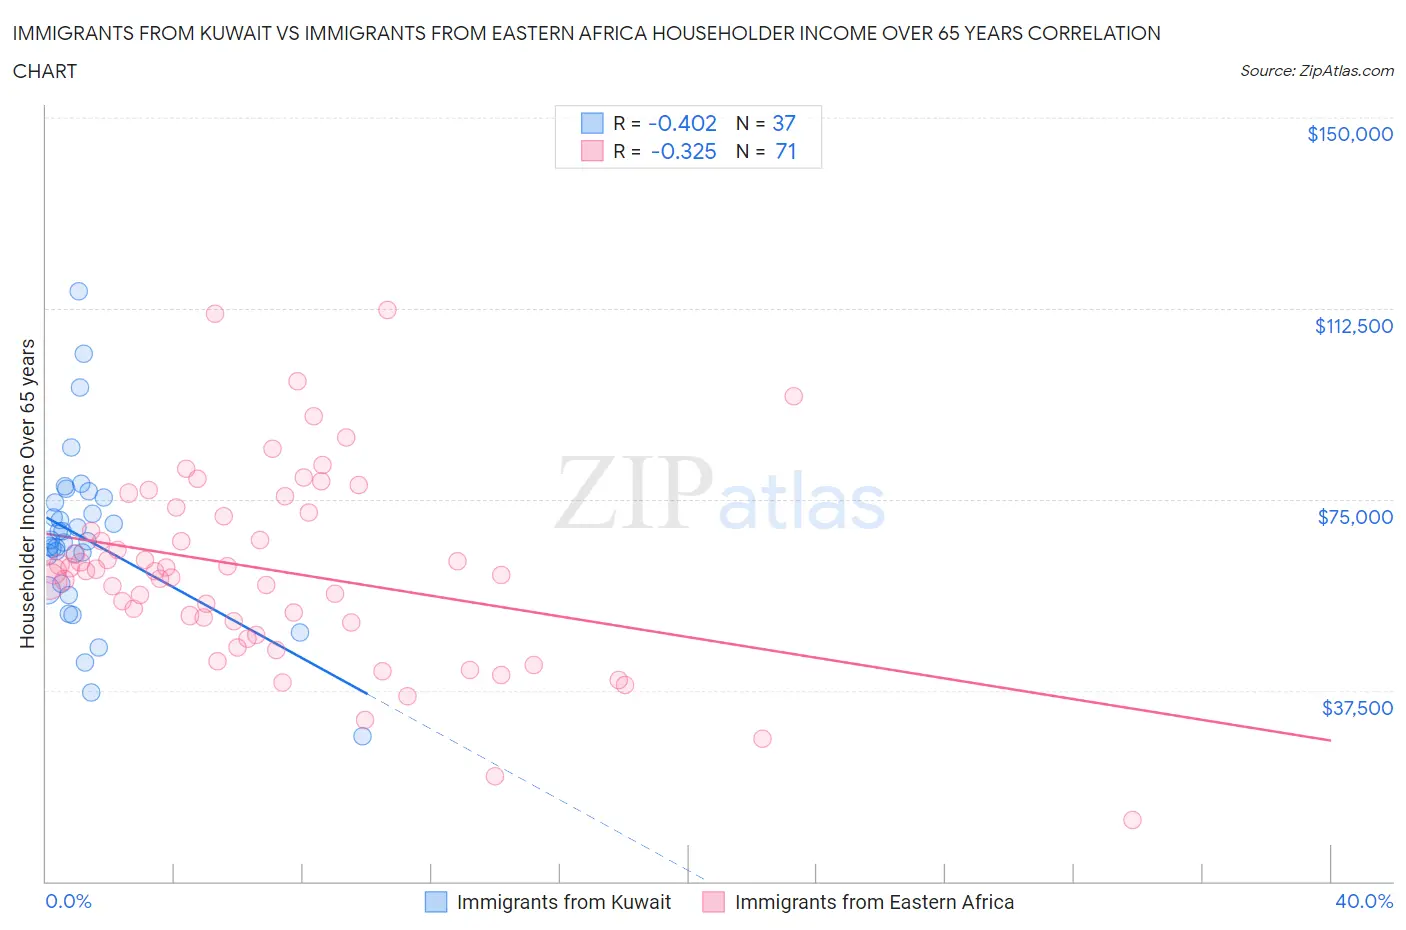
Immigrants from Kuwait vs Immigrants from Eastern Africa Householder Income Over 65 years Correlation Chart
The statistical analysis conducted on geographies consisting of 136,793,097 people shows a moderate negative correlation between the proportion of Immigrants from Kuwait and household income with householder over the age of 65 in the United States with a correlation coefficient (R) of -0.402 and weighted average of $64,433. Similarly, the statistical analysis conducted on geographies consisting of 354,024,909 people shows a mild negative correlation between the proportion of Immigrants from Eastern Africa and household income with householder over the age of 65 in the United States with a correlation coefficient (R) of -0.325 and weighted average of $61,157, a difference of 5.4%.
Householder Income Over 65 years Correlation Summary
| Measurement | Immigrants from Kuwait | Immigrants from Eastern Africa |
| Minimum | $28,380 | $12,049 |
| Maximum | $115,862 | $112,225 |
| Range | $87,482 | $100,176 |
| Mean | $67,223 | $61,052 |
| Median | $66,731 | $60,948 |
| Interquartile 25% (IQ1) | $57,769 | $50,731 |
| Interquartile 75% (IQ3) | $74,875 | $72,534 |
| Interquartile Range (IQR) | $17,105 | $21,803 |
| Standard Deviation (Sample) | $16,728 | $18,747 |
| Standard Deviation (Population) | $16,500 | $18,615 |
Similar Demographics by Householder Income Over 65 years
Demographics Similar to Immigrants from Kuwait by Householder Income Over 65 years
In terms of householder income over 65 years, the demographic groups most similar to Immigrants from Kuwait are Paraguayan ($64,443, a difference of 0.020%), Immigrants from Oceania ($64,416, a difference of 0.030%), Immigrants from Romania ($64,462, a difference of 0.040%), Austrian ($64,470, a difference of 0.060%), and Immigrants from Bulgaria ($64,379, a difference of 0.080%).
| Demographics | Rating | Rank | Householder Income Over 65 years |
| Northern Europeans | 97.9 /100 | #83 | Exceptional $64,658 |
| Immigrants | Greece | 97.9 /100 | #84 | Exceptional $64,636 |
| Immigrants | Lebanon | 97.6 /100 | #85 | Exceptional $64,521 |
| Immigrants | Russia | 97.6 /100 | #86 | Exceptional $64,512 |
| Austrians | 97.5 /100 | #87 | Exceptional $64,470 |
| Immigrants | Romania | 97.5 /100 | #88 | Exceptional $64,462 |
| Paraguayans | 97.4 /100 | #89 | Exceptional $64,443 |
| Immigrants | Kuwait | 97.4 /100 | #90 | Exceptional $64,433 |
| Immigrants | Oceania | 97.4 /100 | #91 | Exceptional $64,416 |
| Immigrants | Bulgaria | 97.3 /100 | #92 | Exceptional $64,379 |
| Jordanians | 97.1 /100 | #93 | Exceptional $64,313 |
| Immigrants | Egypt | 97.0 /100 | #94 | Exceptional $64,299 |
| Immigrants | Latvia | 97.0 /100 | #95 | Exceptional $64,298 |
| Immigrants | Hungary | 97.0 /100 | #96 | Exceptional $64,277 |
| Sri Lankans | 96.7 /100 | #97 | Exceptional $64,201 |
Demographics Similar to Immigrants from Eastern Africa by Householder Income Over 65 years
In terms of householder income over 65 years, the demographic groups most similar to Immigrants from Eastern Africa are Immigrants from Ukraine ($61,163, a difference of 0.010%), Ugandan ($61,177, a difference of 0.030%), Immigrants from North Macedonia ($61,175, a difference of 0.030%), Norwegian ($61,104, a difference of 0.090%), and Irish ($61,097, a difference of 0.10%).
| Demographics | Rating | Rank | Householder Income Over 65 years |
| Brazilians | 62.7 /100 | #159 | Good $61,465 |
| Portuguese | 62.1 /100 | #160 | Good $61,440 |
| Icelanders | 57.9 /100 | #161 | Average $61,270 |
| Czechs | 57.2 /100 | #162 | Average $61,244 |
| Ugandans | 55.5 /100 | #163 | Average $61,177 |
| Immigrants | North Macedonia | 55.4 /100 | #164 | Average $61,175 |
| Immigrants | Ukraine | 55.1 /100 | #165 | Average $61,163 |
| Immigrants | Eastern Africa | 55.0 /100 | #166 | Average $61,157 |
| Norwegians | 53.6 /100 | #167 | Average $61,104 |
| Irish | 53.4 /100 | #168 | Average $61,097 |
| Carpatho Rusyns | 53.3 /100 | #169 | Average $61,093 |
| Serbians | 53.1 /100 | #170 | Average $61,087 |
| Inupiat | 52.4 /100 | #171 | Average $61,061 |
| Immigrants | Poland | 51.9 /100 | #172 | Average $61,041 |
| Immigrants | Micronesia | 50.8 /100 | #173 | Average $61,000 |