Immigrants from Kuwait vs Belgian Median Male Earnings
COMPARE
Immigrants from Kuwait
Belgian
Median Male Earnings
Median Male Earnings Comparison
Immigrants from Kuwait
Belgians
$57,562
MEDIAN MALE EARNINGS
95.3/ 100
METRIC RATING
114th/ 347
METRIC RANK
$55,361
MEDIAN MALE EARNINGS
70.1/ 100
METRIC RATING
161st/ 347
METRIC RANK
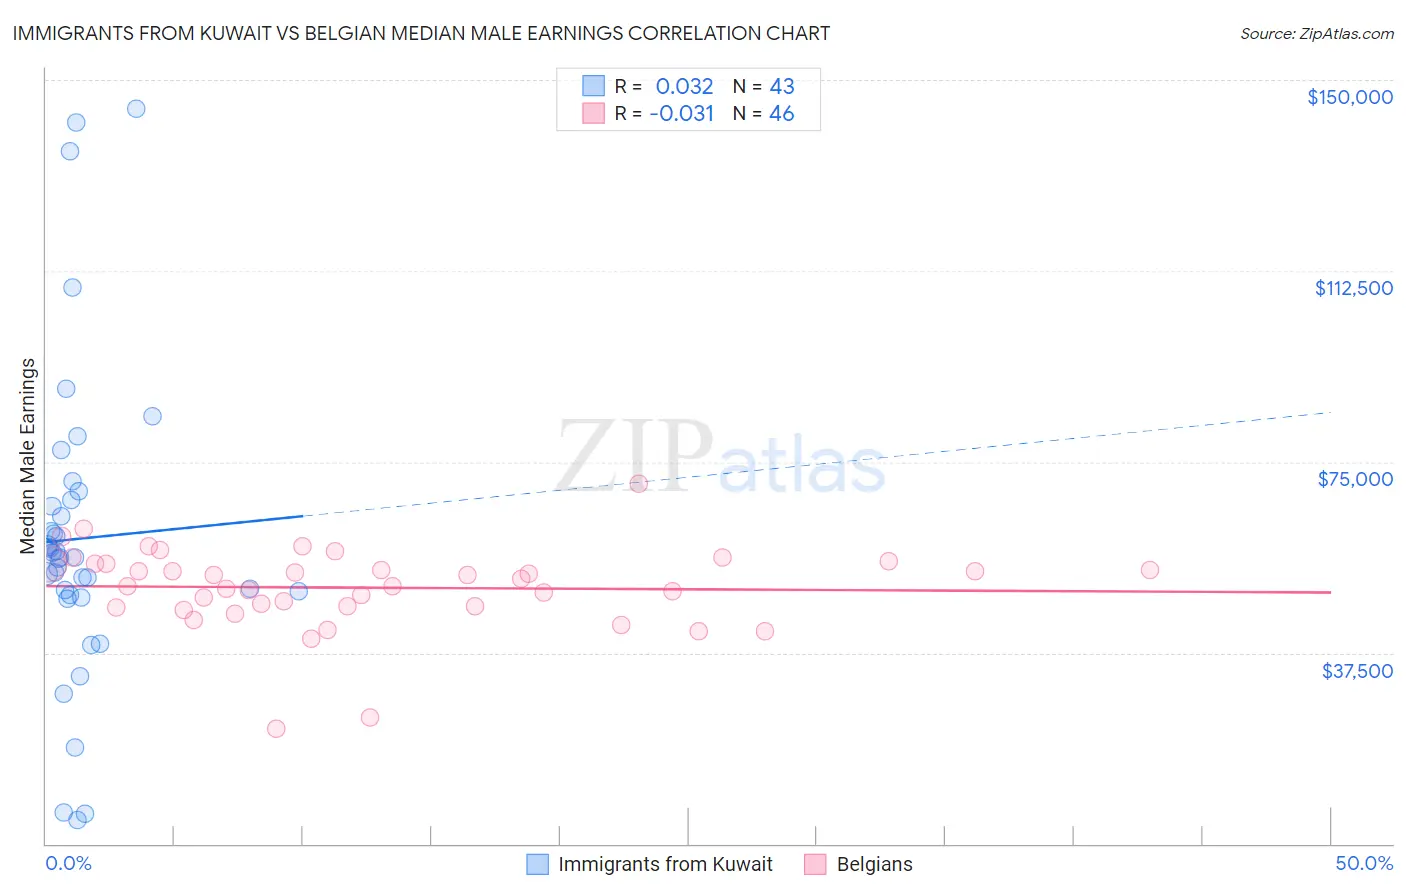
Immigrants from Kuwait vs Belgian Median Male Earnings Correlation Chart
The statistical analysis conducted on geographies consisting of 136,917,085 people shows no correlation between the proportion of Immigrants from Kuwait and median male earnings in the United States with a correlation coefficient (R) of 0.032 and weighted average of $57,562. Similarly, the statistical analysis conducted on geographies consisting of 355,920,572 people shows no correlation between the proportion of Belgians and median male earnings in the United States with a correlation coefficient (R) of -0.031 and weighted average of $55,361, a difference of 4.0%.
Median Male Earnings Correlation Summary
| Measurement | Immigrants from Kuwait | Belgian |
| Minimum | $4,638 | $22,708 |
| Maximum | $144,236 | $70,714 |
| Range | $139,598 | $48,006 |
| Mean | $59,941 | $50,285 |
| Median | $56,335 | $51,372 |
| Interquartile 25% (IQ1) | $48,946 | $46,719 |
| Interquartile 75% (IQ3) | $67,515 | $54,981 |
| Interquartile Range (IQR) | $18,568 | $8,262 |
| Standard Deviation (Sample) | $30,286 | $8,264 |
| Standard Deviation (Population) | $29,932 | $8,174 |
Similar Demographics by Median Male Earnings
Demographics Similar to Immigrants from Kuwait by Median Male Earnings
In terms of median male earnings, the demographic groups most similar to Immigrants from Kuwait are Carpatho Rusyn ($57,572, a difference of 0.020%), Immigrants from Afghanistan ($57,582, a difference of 0.040%), European ($57,637, a difference of 0.13%), Swedish ($57,445, a difference of 0.20%), and Lebanese ($57,409, a difference of 0.27%).
| Demographics | Rating | Rank | Median Male Earnings |
| Serbians | 96.8 /100 | #107 | Exceptional $57,975 |
| Immigrants | Uzbekistan | 96.7 /100 | #108 | Exceptional $57,941 |
| British | 96.5 /100 | #109 | Exceptional $57,890 |
| Palestinians | 96.2 /100 | #110 | Exceptional $57,778 |
| Europeans | 95.6 /100 | #111 | Exceptional $57,637 |
| Immigrants | Afghanistan | 95.4 /100 | #112 | Exceptional $57,582 |
| Carpatho Rusyns | 95.3 /100 | #113 | Exceptional $57,572 |
| Immigrants | Kuwait | 95.3 /100 | #114 | Exceptional $57,562 |
| Swedes | 94.8 /100 | #115 | Exceptional $57,445 |
| Lebanese | 94.6 /100 | #116 | Exceptional $57,409 |
| Immigrants | Zimbabwe | 94.3 /100 | #117 | Exceptional $57,352 |
| Hungarians | 94.0 /100 | #118 | Exceptional $57,309 |
| Arabs | 94.0 /100 | #119 | Exceptional $57,298 |
| Canadians | 93.9 /100 | #120 | Exceptional $57,286 |
| Immigrants | Albania | 93.3 /100 | #121 | Exceptional $57,179 |
Demographics Similar to Belgians by Median Male Earnings
In terms of median male earnings, the demographic groups most similar to Belgians are Basque ($55,370, a difference of 0.020%), French ($55,350, a difference of 0.020%), Alsatian ($55,380, a difference of 0.030%), Czechoslovakian ($55,382, a difference of 0.040%), and Icelander ($55,415, a difference of 0.10%).
| Demographics | Rating | Rank | Median Male Earnings |
| Taiwanese | 73.9 /100 | #154 | Good $55,556 |
| Scandinavians | 73.4 /100 | #155 | Good $55,527 |
| Immigrants | Ethiopia | 71.6 /100 | #156 | Good $55,434 |
| Icelanders | 71.2 /100 | #157 | Good $55,415 |
| Czechoslovakians | 70.5 /100 | #158 | Good $55,382 |
| Alsatians | 70.5 /100 | #159 | Good $55,380 |
| Basques | 70.3 /100 | #160 | Good $55,370 |
| Belgians | 70.1 /100 | #161 | Good $55,361 |
| French | 69.9 /100 | #162 | Good $55,350 |
| Ugandans | 68.6 /100 | #163 | Good $55,290 |
| Immigrants | South Eastern Asia | 67.6 /100 | #164 | Good $55,241 |
| Immigrants | Portugal | 66.3 /100 | #165 | Good $55,182 |
| Germans | 61.6 /100 | #166 | Good $54,974 |
| Immigrants | Fiji | 61.2 /100 | #167 | Good $54,958 |
| Immigrants | Vietnam | 60.2 /100 | #168 | Good $54,913 |