Immigrants from Korea vs Inupiat Median Family Income
COMPARE
Immigrants from Korea
Inupiat
Median Family Income
Median Family Income Comparison
Immigrants from Korea
Inupiat
$122,800
MEDIAN FAMILY INCOME
100.0/ 100
METRIC RATING
21st/ 347
METRIC RANK
$91,730
MEDIAN FAMILY INCOME
0.4/ 100
METRIC RATING
261st/ 347
METRIC RANK
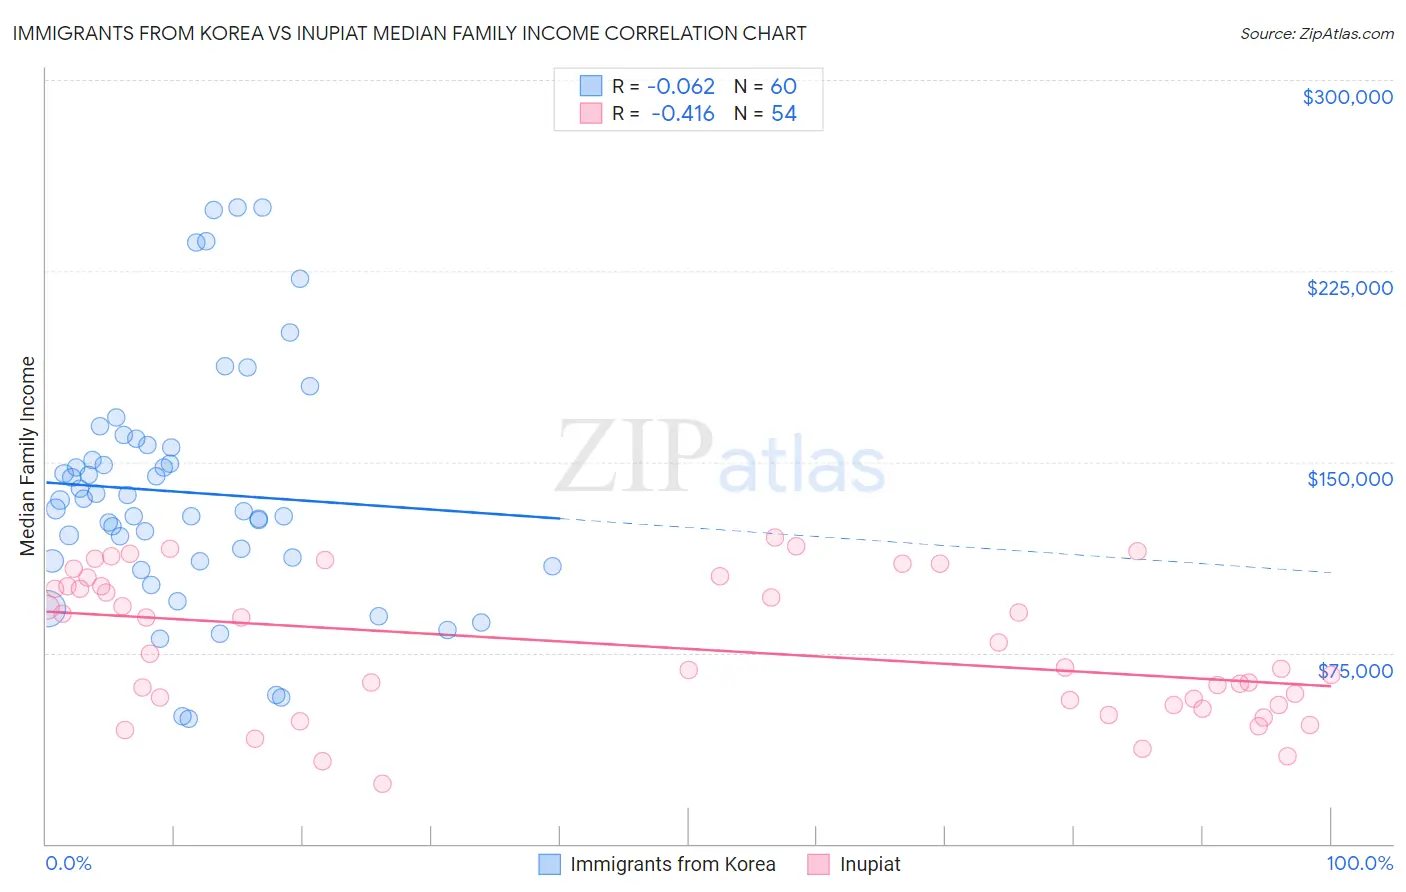
Immigrants from Korea vs Inupiat Median Family Income Correlation Chart
The statistical analysis conducted on geographies consisting of 415,814,318 people shows a slight negative correlation between the proportion of Immigrants from Korea and median family income in the United States with a correlation coefficient (R) of -0.062 and weighted average of $122,800. Similarly, the statistical analysis conducted on geographies consisting of 96,309,592 people shows a moderate negative correlation between the proportion of Inupiat and median family income in the United States with a correlation coefficient (R) of -0.416 and weighted average of $91,730, a difference of 33.9%.
Median Family Income Correlation Summary
| Measurement | Immigrants from Korea | Inupiat |
| Minimum | $49,182 | $23,690 |
| Maximum | $250,001 | $120,501 |
| Range | $200,819 | $96,811 |
| Mean | $138,061 | $77,500 |
| Median | $133,220 | $72,103 |
| Interquartile 25% (IQ1) | $110,996 | $54,583 |
| Interquartile 75% (IQ3) | $156,101 | $101,242 |
| Interquartile Range (IQR) | $45,105 | $46,659 |
| Standard Deviation (Sample) | $47,393 | $27,340 |
| Standard Deviation (Population) | $46,996 | $27,086 |
Similar Demographics by Median Family Income
Demographics Similar to Immigrants from Korea by Median Family Income
In terms of median family income, the demographic groups most similar to Immigrants from Korea are Immigrants from Sweden ($122,765, a difference of 0.030%), Immigrants from Japan ($122,764, a difference of 0.030%), Burmese ($123,369, a difference of 0.46%), Immigrants from Northern Europe ($121,840, a difference of 0.79%), and Immigrants from Belgium ($123,831, a difference of 0.84%).
| Demographics | Rating | Rank | Median Family Income |
| Immigrants | South Central Asia | 100.0 /100 | #14 | Exceptional $125,956 |
| Eastern Europeans | 100.0 /100 | #15 | Exceptional $125,546 |
| Immigrants | China | 100.0 /100 | #16 | Exceptional $125,540 |
| Indians (Asian) | 100.0 /100 | #17 | Exceptional $125,312 |
| Immigrants | Eastern Asia | 100.0 /100 | #18 | Exceptional $125,150 |
| Immigrants | Belgium | 100.0 /100 | #19 | Exceptional $123,831 |
| Burmese | 100.0 /100 | #20 | Exceptional $123,369 |
| Immigrants | Korea | 100.0 /100 | #21 | Exceptional $122,800 |
| Immigrants | Sweden | 100.0 /100 | #22 | Exceptional $122,765 |
| Immigrants | Japan | 100.0 /100 | #23 | Exceptional $122,764 |
| Immigrants | Northern Europe | 100.0 /100 | #24 | Exceptional $121,840 |
| Turks | 100.0 /100 | #25 | Exceptional $121,202 |
| Immigrants | Switzerland | 100.0 /100 | #26 | Exceptional $120,726 |
| Russians | 100.0 /100 | #27 | Exceptional $120,487 |
| Immigrants | Denmark | 100.0 /100 | #28 | Exceptional $120,445 |
Demographics Similar to Inupiat by Median Family Income
In terms of median family income, the demographic groups most similar to Inupiat are Liberian ($91,722, a difference of 0.010%), Pennsylvania German ($91,763, a difference of 0.040%), Cape Verdean ($91,848, a difference of 0.13%), Immigrants from West Indies ($91,588, a difference of 0.16%), and Osage ($91,926, a difference of 0.21%).
| Demographics | Rating | Rank | Median Family Income |
| Immigrants | Barbados | 0.5 /100 | #254 | Tragic $92,419 |
| Immigrants | Laos | 0.5 /100 | #255 | Tragic $92,239 |
| Nicaraguans | 0.5 /100 | #256 | Tragic $92,231 |
| Americans | 0.4 /100 | #257 | Tragic $92,096 |
| Osage | 0.4 /100 | #258 | Tragic $91,926 |
| Cape Verdeans | 0.4 /100 | #259 | Tragic $91,848 |
| Pennsylvania Germans | 0.4 /100 | #260 | Tragic $91,763 |
| Inupiat | 0.4 /100 | #261 | Tragic $91,730 |
| Liberians | 0.4 /100 | #262 | Tragic $91,722 |
| Immigrants | West Indies | 0.3 /100 | #263 | Tragic $91,588 |
| Senegalese | 0.3 /100 | #264 | Tragic $91,475 |
| Hmong | 0.3 /100 | #265 | Tragic $91,296 |
| Central Americans | 0.3 /100 | #266 | Tragic $91,087 |
| Mexican American Indians | 0.2 /100 | #267 | Tragic $90,918 |
| Cree | 0.2 /100 | #268 | Tragic $90,882 |