Immigrants from Korea vs Immigrants from Europe Householder Income Under 25 years
COMPARE
Immigrants from Korea
Immigrants from Europe
Householder Income Under 25 years
Householder Income Under 25 years Comparison
Immigrants from Korea
Immigrants from Europe
$55,716
HOUSEHOLDER INCOME UNDER 25 YEARS
100.0/ 100
METRIC RATING
42nd/ 347
METRIC RANK
$55,022
HOUSEHOLDER INCOME UNDER 25 YEARS
99.9/ 100
METRIC RATING
61st/ 347
METRIC RANK
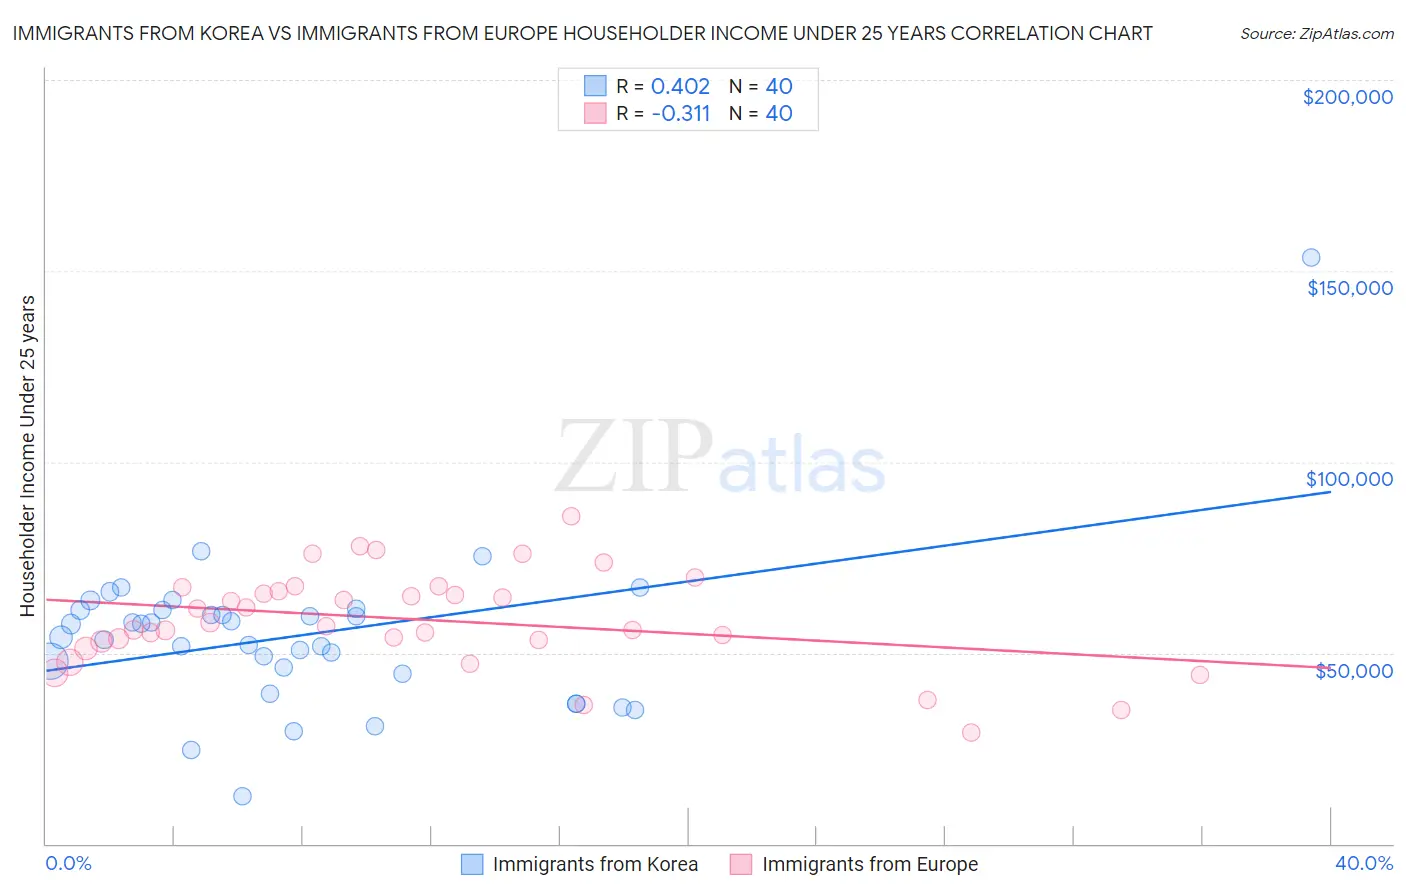
Immigrants from Korea vs Immigrants from Europe Householder Income Under 25 years Correlation Chart
The statistical analysis conducted on geographies consisting of 348,325,836 people shows a moderate positive correlation between the proportion of Immigrants from Korea and household income with householder under the age of 25 in the United States with a correlation coefficient (R) of 0.402 and weighted average of $55,716. Similarly, the statistical analysis conducted on geographies consisting of 429,730,992 people shows a mild negative correlation between the proportion of Immigrants from Europe and household income with householder under the age of 25 in the United States with a correlation coefficient (R) of -0.311 and weighted average of $55,022, a difference of 1.3%.
Householder Income Under 25 years Correlation Summary
| Measurement | Immigrants from Korea | Immigrants from Europe |
| Minimum | $12,383 | $29,167 |
| Maximum | $153,485 | $85,625 |
| Range | $141,102 | $56,458 |
| Mean | $54,433 | $58,753 |
| Median | $55,776 | $57,388 |
| Interquartile 25% (IQ1) | $45,346 | $53,236 |
| Interquartile 75% (IQ3) | $61,192 | $66,581 |
| Interquartile Range (IQR) | $15,846 | $13,345 |
| Standard Deviation (Sample) | $21,118 | $12,547 |
| Standard Deviation (Population) | $20,853 | $12,389 |
Demographics Similar to Immigrants from Korea and Immigrants from Europe by Householder Income Under 25 years
In terms of householder income under 25 years, the demographic groups most similar to Immigrants from Korea are Immigrants from South Eastern Asia ($55,714, a difference of 0.0%), Immigrants from Guyana ($55,726, a difference of 0.020%), Paraguayan ($55,614, a difference of 0.18%), Spanish American Indian ($55,573, a difference of 0.26%), and Immigrants from Eastern Europe ($55,572, a difference of 0.26%). Similarly, the demographic groups most similar to Immigrants from Europe are Immigrants from Lithuania ($55,028, a difference of 0.010%), Native Hawaiian ($55,158, a difference of 0.25%), Guyanese ($55,210, a difference of 0.34%), Soviet Union ($55,340, a difference of 0.58%), and Salvadoran ($55,412, a difference of 0.71%).
| Demographics | Rating | Rank | Householder Income Under 25 years |
| Immigrants | Guyana | 100.0 /100 | #41 | Exceptional $55,726 |
| Immigrants | Korea | 100.0 /100 | #42 | Exceptional $55,716 |
| Immigrants | South Eastern Asia | 100.0 /100 | #43 | Exceptional $55,714 |
| Paraguayans | 100.0 /100 | #44 | Exceptional $55,614 |
| Spanish American Indians | 100.0 /100 | #45 | Exceptional $55,573 |
| Immigrants | Eastern Europe | 100.0 /100 | #46 | Exceptional $55,572 |
| Cambodians | 100.0 /100 | #47 | Exceptional $55,571 |
| Immigrants | Vietnam | 100.0 /100 | #48 | Exceptional $55,562 |
| Iranians | 100.0 /100 | #49 | Exceptional $55,548 |
| Puget Sound Salish | 100.0 /100 | #50 | Exceptional $55,543 |
| Immigrants | Romania | 100.0 /100 | #51 | Exceptional $55,522 |
| Immigrants | Indonesia | 100.0 /100 | #52 | Exceptional $55,521 |
| Immigrants | Poland | 100.0 /100 | #53 | Exceptional $55,474 |
| Sri Lankans | 100.0 /100 | #54 | Exceptional $55,470 |
| Immigrants | Ukraine | 100.0 /100 | #55 | Exceptional $55,447 |
| Salvadorans | 100.0 /100 | #56 | Exceptional $55,412 |
| Soviet Union | 100.0 /100 | #57 | Exceptional $55,340 |
| Guyanese | 99.9 /100 | #58 | Exceptional $55,210 |
| Native Hawaiians | 99.9 /100 | #59 | Exceptional $55,158 |
| Immigrants | Lithuania | 99.9 /100 | #60 | Exceptional $55,028 |
| Immigrants | Europe | 99.9 /100 | #61 | Exceptional $55,022 |