Immigrants from Kenya vs Immigrants from Western Europe Median Earnings
COMPARE
Immigrants from Kenya
Immigrants from Western Europe
Median Earnings
Median Earnings Comparison
Immigrants from Kenya
Immigrants from Western Europe
$46,214
MEDIAN EARNINGS
42.4/ 100
METRIC RATING
184th/ 347
METRIC RANK
$50,549
MEDIAN EARNINGS
99.7/ 100
METRIC RATING
77th/ 347
METRIC RANK
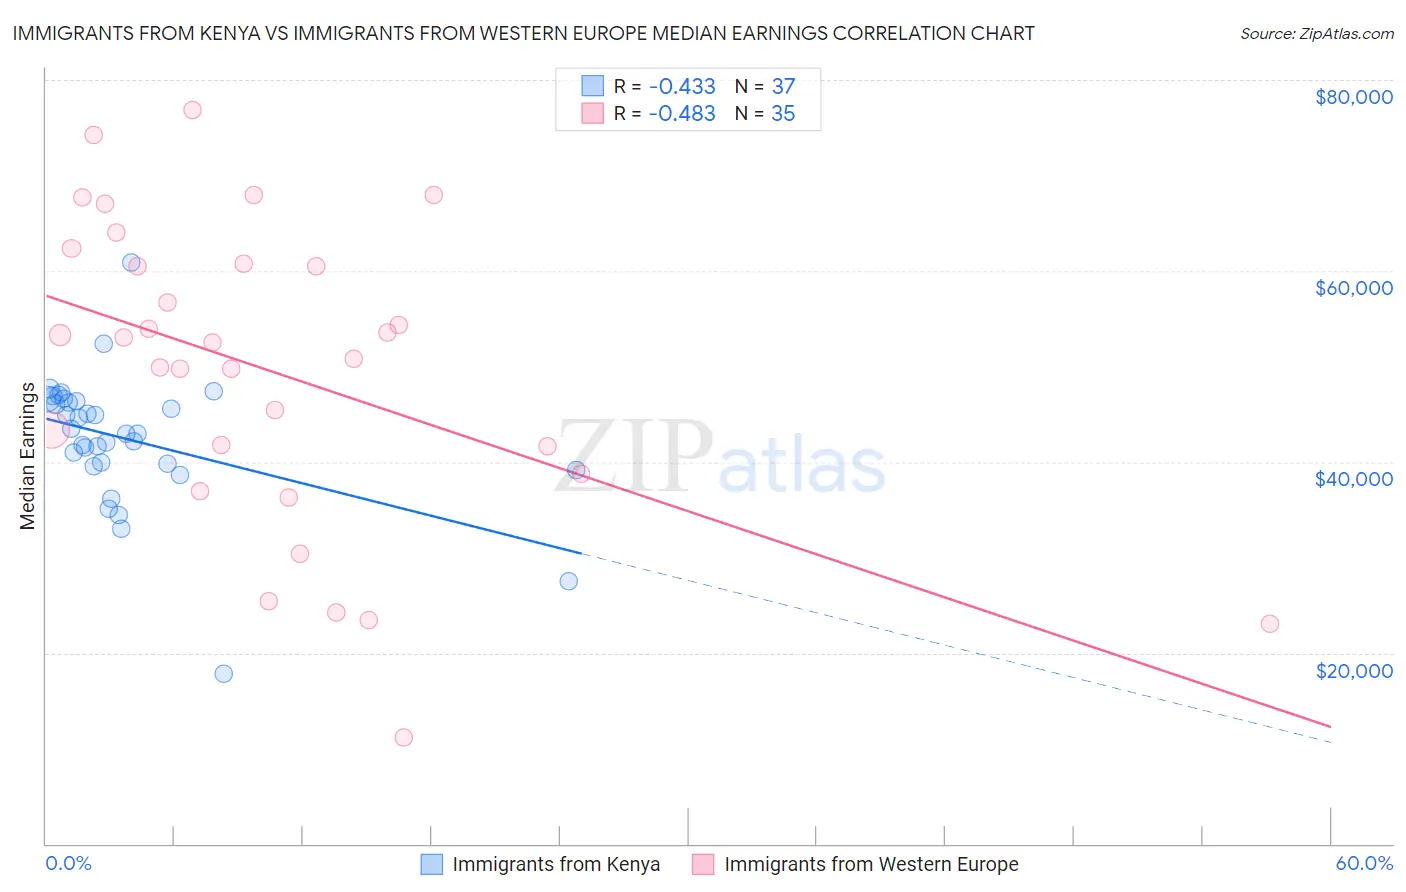
Immigrants from Kenya vs Immigrants from Western Europe Median Earnings Correlation Chart
The statistical analysis conducted on geographies consisting of 218,063,953 people shows a moderate negative correlation between the proportion of Immigrants from Kenya and median earnings in the United States with a correlation coefficient (R) of -0.433 and weighted average of $46,214. Similarly, the statistical analysis conducted on geographies consisting of 493,982,841 people shows a moderate negative correlation between the proportion of Immigrants from Western Europe and median earnings in the United States with a correlation coefficient (R) of -0.483 and weighted average of $50,549, a difference of 9.4%.
Median Earnings Correlation Summary
| Measurement | Immigrants from Kenya | Immigrants from Western Europe |
| Minimum | $17,794 | $11,184 |
| Maximum | $60,938 | $76,795 |
| Range | $43,144 | $65,611 |
| Mean | $42,338 | $49,401 |
| Median | $42,995 | $52,565 |
| Interquartile 25% (IQ1) | $39,646 | $38,750 |
| Interquartile 75% (IQ3) | $46,440 | $60,761 |
| Interquartile Range (IQR) | $6,794 | $22,011 |
| Standard Deviation (Sample) | $7,069 | $15,918 |
| Standard Deviation (Population) | $6,973 | $15,689 |
Similar Demographics by Median Earnings
Demographics Similar to Immigrants from Kenya by Median Earnings
In terms of median earnings, the demographic groups most similar to Immigrants from Kenya are Uruguayan ($46,190, a difference of 0.050%), Vietnamese ($46,172, a difference of 0.090%), Iraqi ($46,140, a difference of 0.16%), French ($46,296, a difference of 0.18%), and Swiss ($46,315, a difference of 0.22%).
| Demographics | Rating | Rank | Median Earnings |
| Belgians | 48.0 /100 | #177 | Average $46,375 |
| Colombians | 47.1 /100 | #178 | Average $46,349 |
| English | 46.5 /100 | #179 | Average $46,334 |
| Puget Sound Salish | 46.5 /100 | #180 | Average $46,333 |
| Immigrants | Cameroon | 46.4 /100 | #181 | Average $46,329 |
| Swiss | 45.9 /100 | #182 | Average $46,315 |
| French | 45.2 /100 | #183 | Average $46,296 |
| Immigrants | Kenya | 42.4 /100 | #184 | Average $46,214 |
| Uruguayans | 41.6 /100 | #185 | Average $46,190 |
| Vietnamese | 40.9 /100 | #186 | Average $46,172 |
| Iraqis | 39.9 /100 | #187 | Fair $46,140 |
| Immigrants | Armenia | 38.3 /100 | #188 | Fair $46,094 |
| Spaniards | 37.2 /100 | #189 | Fair $46,059 |
| French Canadians | 36.1 /100 | #190 | Fair $46,026 |
| Finns | 33.4 /100 | #191 | Fair $45,940 |
Demographics Similar to Immigrants from Western Europe by Median Earnings
In terms of median earnings, the demographic groups most similar to Immigrants from Western Europe are Immigrants from Italy ($50,581, a difference of 0.060%), Argentinean ($50,399, a difference of 0.30%), Immigrants from Scotland ($50,741, a difference of 0.38%), South African ($50,752, a difference of 0.40%), and Laotian ($50,343, a difference of 0.41%).
| Demographics | Rating | Rank | Median Earnings |
| Lithuanians | 99.8 /100 | #70 | Exceptional $50,991 |
| Immigrants | Ukraine | 99.8 /100 | #71 | Exceptional $50,984 |
| Immigrants | Egypt | 99.8 /100 | #72 | Exceptional $50,901 |
| Immigrants | Netherlands | 99.8 /100 | #73 | Exceptional $50,818 |
| South Africans | 99.8 /100 | #74 | Exceptional $50,752 |
| Immigrants | Scotland | 99.8 /100 | #75 | Exceptional $50,741 |
| Immigrants | Italy | 99.7 /100 | #76 | Exceptional $50,581 |
| Immigrants | Western Europe | 99.7 /100 | #77 | Exceptional $50,549 |
| Argentineans | 99.6 /100 | #78 | Exceptional $50,399 |
| Laotians | 99.6 /100 | #79 | Exceptional $50,343 |
| Ukrainians | 99.6 /100 | #80 | Exceptional $50,320 |
| Immigrants | Southern Europe | 99.6 /100 | #81 | Exceptional $50,280 |
| Immigrants | Moldova | 99.5 /100 | #82 | Exceptional $50,274 |
| Romanians | 99.5 /100 | #83 | Exceptional $50,244 |
| Immigrants | Hungary | 99.5 /100 | #84 | Exceptional $50,227 |