Immigrants from Jordan vs Ugandan Wage/Income Gap
COMPARE
Immigrants from Jordan
Ugandan
Wage/Income Gap
Wage/Income Gap Comparison
Immigrants from Jordan
Ugandans
26.3%
WAGE/INCOME GAP
22.4/ 100
METRIC RATING
193rd/ 347
METRIC RANK
24.1%
WAGE/INCOME GAP
98.3/ 100
METRIC RATING
109th/ 347
METRIC RANK
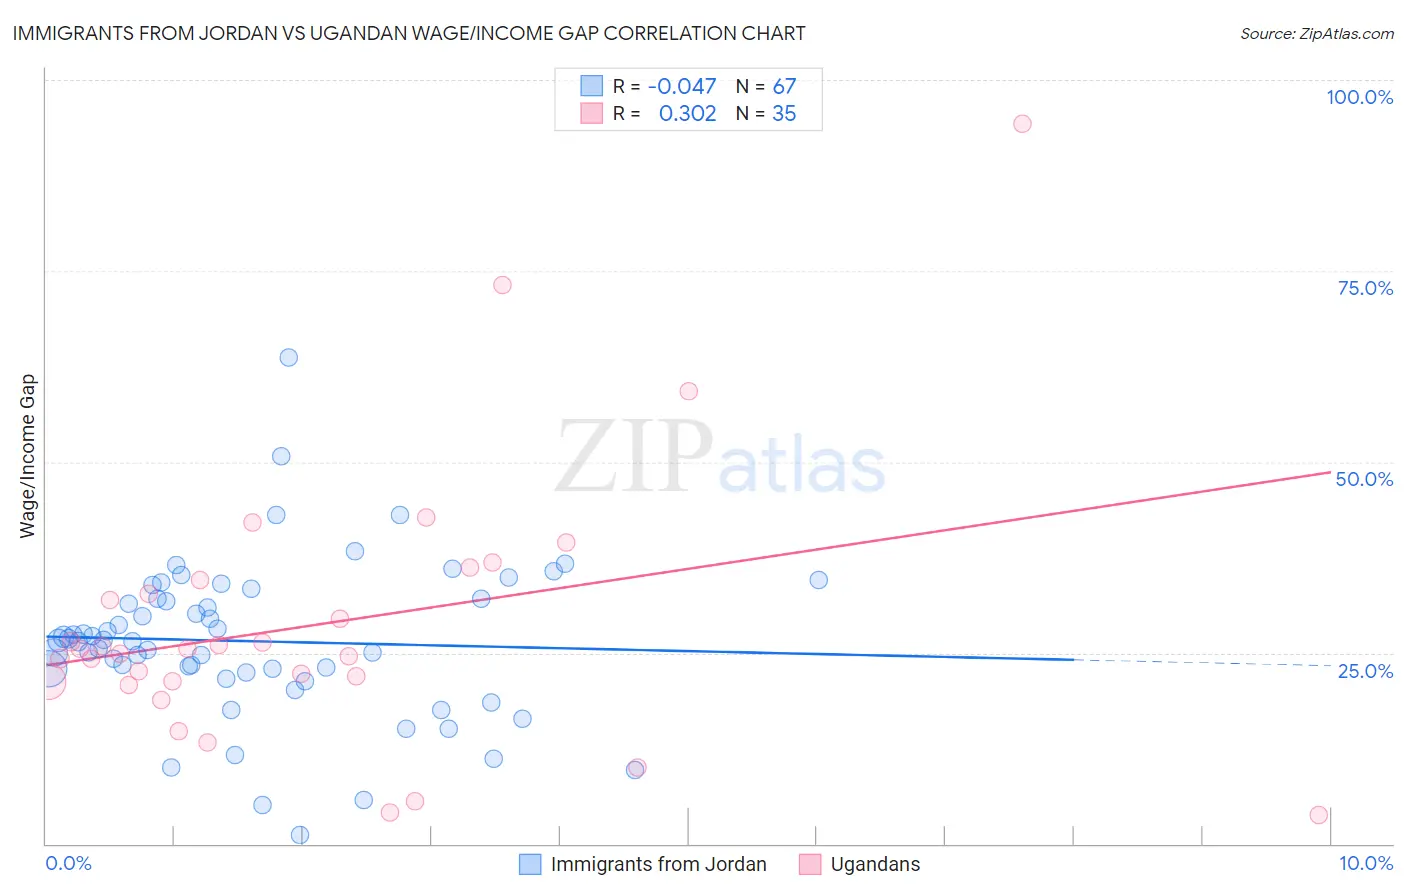
Immigrants from Jordan vs Ugandan Wage/Income Gap Correlation Chart
The statistical analysis conducted on geographies consisting of 181,259,596 people shows no correlation between the proportion of Immigrants from Jordan and wage/income gap percentage in the United States with a correlation coefficient (R) of -0.047 and weighted average of 26.3%. Similarly, the statistical analysis conducted on geographies consisting of 94,009,821 people shows a mild positive correlation between the proportion of Ugandans and wage/income gap percentage in the United States with a correlation coefficient (R) of 0.302 and weighted average of 24.1%, a difference of 9.3%.
Wage/Income Gap Correlation Summary
| Measurement | Immigrants from Jordan | Ugandan |
| Minimum | 1.1% | 3.7% |
| Maximum | 63.6% | 94.2% |
| Range | 62.5% | 90.5% |
| Mean | 26.5% | 28.8% |
| Median | 26.6% | 25.5% |
| Interquartile 25% (IQ1) | 22.3% | 21.3% |
| Interquartile 75% (IQ3) | 32.1% | 34.5% |
| Interquartile Range (IQR) | 9.7% | 13.3% |
| Standard Deviation (Sample) | 10.3% | 17.9% |
| Standard Deviation (Population) | 10.2% | 17.7% |
Similar Demographics by Wage/Income Gap
Demographics Similar to Immigrants from Jordan by Wage/Income Gap
In terms of wage/income gap, the demographic groups most similar to Immigrants from Jordan are Chilean (26.3%, a difference of 0.0%), Immigrants from Bulgaria (26.3%, a difference of 0.020%), Immigrants from Malaysia (26.3%, a difference of 0.020%), Immigrants from Western Asia (26.3%, a difference of 0.060%), and Zimbabwean (26.3%, a difference of 0.070%).
| Demographics | Rating | Rank | Wage/Income Gap |
| Immigrants | Indonesia | 32.5 /100 | #186 | Fair 26.1% |
| Palestinians | 29.9 /100 | #187 | Fair 26.1% |
| Immigrants | Egypt | 29.9 /100 | #188 | Fair 26.1% |
| Immigrants | Moldova | 26.6 /100 | #189 | Fair 26.2% |
| Immigrants | Croatia | 24.8 /100 | #190 | Fair 26.2% |
| Immigrants | Venezuela | 24.7 /100 | #191 | Fair 26.2% |
| Immigrants | Bulgaria | 22.5 /100 | #192 | Fair 26.3% |
| Immigrants | Jordan | 22.4 /100 | #193 | Fair 26.3% |
| Chileans | 22.3 /100 | #194 | Fair 26.3% |
| Immigrants | Malaysia | 22.2 /100 | #195 | Fair 26.3% |
| Immigrants | Western Asia | 21.7 /100 | #196 | Fair 26.3% |
| Zimbabweans | 21.6 /100 | #197 | Fair 26.3% |
| Venezuelans | 21.5 /100 | #198 | Fair 26.3% |
| Dutch West Indians | 21.0 /100 | #199 | Fair 26.3% |
| Delaware | 20.9 /100 | #200 | Fair 26.3% |
Demographics Similar to Ugandans by Wage/Income Gap
In terms of wage/income gap, the demographic groups most similar to Ugandans are Yaqui (24.0%, a difference of 0.060%), Immigrants from Albania (24.0%, a difference of 0.060%), Immigrants from Morocco (24.1%, a difference of 0.22%), Sudanese (24.0%, a difference of 0.36%), and Moroccan (24.0%, a difference of 0.37%).
| Demographics | Rating | Rank | Wage/Income Gap |
| Immigrants | Laos | 99.0 /100 | #102 | Exceptional 23.8% |
| Tsimshian | 98.9 /100 | #103 | Exceptional 23.9% |
| Tlingit-Haida | 98.7 /100 | #104 | Exceptional 24.0% |
| Moroccans | 98.6 /100 | #105 | Exceptional 24.0% |
| Sudanese | 98.6 /100 | #106 | Exceptional 24.0% |
| Yaqui | 98.4 /100 | #107 | Exceptional 24.0% |
| Immigrants | Albania | 98.4 /100 | #108 | Exceptional 24.0% |
| Ugandans | 98.3 /100 | #109 | Exceptional 24.1% |
| Immigrants | Morocco | 98.1 /100 | #110 | Exceptional 24.1% |
| Soviet Union | 97.6 /100 | #111 | Exceptional 24.2% |
| Immigrants | Colombia | 97.0 /100 | #112 | Exceptional 24.3% |
| Sioux | 96.9 /100 | #113 | Exceptional 24.3% |
| Panamanians | 96.5 /100 | #114 | Exceptional 24.4% |
| Immigrants | Kenya | 96.4 /100 | #115 | Exceptional 24.4% |
| Alaska Natives | 96.0 /100 | #116 | Exceptional 24.4% |