Immigrants from Jordan vs Creek Median Household Income

COMPARE

Immigrants from Jordan
Race
Ancestry
AfghanAfricanAlaska NativeAlaskan AthabascanAlbanianAleutAlsatianAmericanApacheArabArapahoArgentineanArmenianAssyrian/Chaldean/SyriacAustralianAustrianBahamianBangladeshiBarbadianBasqueBelgianBelizeanBermudanBhutaneseBlackfeetBolivianBrazilianBritishBritish West IndianBulgarianBurmeseCajunCambodianCanadianCape VerdeanCarpatho RusynCelticCentral AmericanCentral American IndianCherokeeCheyenneChickasawChileanChineseChippewaChoctawColombianColvilleComancheCosta RicanCreeCroatianCrowCubanCypriotCzechCzechoslovakianDanishDelawareDominicanDutchDutch West IndianEastern EuropeanEcuadorianEgyptianEnglishEstonianEthiopianEuropeanFijianFilipinoFinnishFrenchFrench American IndianFrench CanadianGermanGerman RussianGhanaianGreekGuamanian/ChamorroGuatemalanGuyaneseHaitianHmongHonduranHopiHoumaHungarianIcelanderIndian (Asian)IndonesianInupiatIranianIraqiIrishIroquoisIsraeliItalianJamaicanJapaneseJordanianKenyanKiowaKoreanLaotianLatvianLebaneseLiberianLithuanianLumbeeLuxembourgerMacedonianMalaysianMalteseMarshalleseMenomineeMexicanMexican American IndianMongolianMoroccanNative HawaiianNavajoNepaleseNew ZealanderNicaraguanNigerianNorthern EuropeanNorwegianOkinawanOsageOttawaPaiutePakistaniPalestinianPanamanianParaguayanPennsylvania GermanPeruvianPimaPolishPortuguesePotawatomiPuebloPuerto RicanPuget Sound SalishRomanianRussianSalvadoranSamoanScandinavianScotch-IrishScottishSeminoleSenegaleseSerbianShoshoneSierra LeoneanSiouxSlavicSlovakSloveneSomaliSouth AfricanSouth AmericanSouth American IndianSoviet UnionSpaniardSpanishSpanish AmericanSpanish American IndianSri LankanSubsaharan AfricanSudaneseSwedishSwissSyrianTaiwaneseThaiTlingit-HaidaTohono O'OdhamTonganTrinidadian and TobagonianTsimshianTurkishU.S. Virgin IslanderUgandanUkrainianUruguayanUteVenezuelanVietnameseWelshWest IndianYakamaYaquiYugoslavianYumanYup'ikZimbabwean
Immigration
NonimmigrantsImmigrantsAfghanistanAfricaAlbaniaArgentinaArmeniaAsiaAustraliaAustriaBahamasBangladeshBarbadosBelarusBelgiumBelizeBoliviaBosnia and HerzegovinaBrazilBulgariaBurma/MyanmarCabo VerdeCambodiaCameroonCanadaCaribbeanCentral AmericaChileChinaColombiaCongoCosta RicaCroatiaCubaCzechoslovakiaDenmarkDominicaDominican RepublicEastern AfricaEastern AsiaEastern EuropeEcuadorEgyptEl SalvadorEnglandEritreaEthiopiaEuropeFijiFranceGermanyGhanaGreeceGrenadaGuatemalaGuyanaHaitiHondurasHong KongHungaryIndiaIndonesiaIranIraqIrelandIsraelItalyJamaicaJapanJordanKazakhstanKenyaKoreaKuwaitLaosLatin AmericaLatviaLebanonLiberiaLithuaniaMalaysiaMexicoMicronesiaMiddle AfricaMoldovaMoroccoNepalNetherlandsNicaraguaNigeriaNorth AmericaNorth MacedoniaNorthern AfricaNorthern EuropeNorwayOceaniaPakistanPanamaPeruPhilippinesPolandPortugalRomaniaRussiaSaudi ArabiaScotlandSenegalSerbiaSierra LeoneSingaporeSomaliaSouth AfricaSouth AmericaSouth Central AsiaSouth Eastern AsiaSouthern EuropeSpainSri LankaSt. Vincent and the GrenadinesSudanSwedenSwitzerlandSyriaTaiwanThailandTrinidad and TobagoTurkeyUgandaUkraineUruguayUzbekistanVenezuelaVietnamWest IndiesWestern AfricaWestern AsiaWestern EuropeYemenZaireZimbabweAzores
Creek
Race
Ancestry
AfghanAfricanAlaska NativeAlaskan AthabascanAlbanianAleutAlsatianAmericanApacheArabArapahoArgentineanArmenianAssyrian/Chaldean/SyriacAustralianAustrianBahamianBangladeshiBarbadianBasqueBelgianBelizeanBermudanBhutaneseBlackfeetBolivianBrazilianBritishBritish West IndianBulgarianBurmeseCajunCambodianCanadianCape VerdeanCarpatho RusynCelticCentral AmericanCentral American IndianCherokeeCheyenneChickasawChileanChineseChippewaChoctawColombianColvilleComancheCosta RicanCreeCreekCroatianCrowCubanCypriotCzechCzechoslovakianDanishDelawareDominicanDutchDutch West IndianEastern EuropeanEcuadorianEgyptianEnglishEstonianEthiopianEuropeanFijianFilipinoFinnishFrenchFrench American IndianFrench CanadianGermanGerman RussianGhanaianGreekGuamanian/ChamorroGuatemalanGuyaneseHaitianHmongHonduranHopiHoumaHungarianIcelanderIndian (Asian)IndonesianInupiatIranianIraqiIrishIroquoisIsraeliItalianJamaicanJapaneseJordanianKenyanKiowaKoreanLaotianLatvianLebaneseLiberianLithuanianLumbeeLuxembourgerMacedonianMalaysianMalteseMarshalleseMenomineeMexicanMexican American IndianMongolianMoroccanNative HawaiianNavajoNepaleseNew ZealanderNicaraguanNigerianNorthern EuropeanNorwegianOkinawanOsageOttawaPaiutePakistaniPalestinianPanamanianParaguayanPennsylvania GermanPeruvianPimaPolishPortuguesePotawatomiPuebloPuerto RicanPuget Sound SalishRomanianRussianSalvadoranSamoanScandinavianScotch-IrishScottishSeminoleSenegaleseSerbianShoshoneSierra LeoneanSiouxSlavicSlovakSloveneSomaliSouth AfricanSouth AmericanSouth American IndianSoviet UnionSpaniardSpanishSpanish AmericanSpanish American IndianSri LankanSubsaharan AfricanSudaneseSwedishSwissSyrianTaiwaneseThaiTlingit-HaidaTohono O'OdhamTonganTrinidadian and TobagonianTsimshianTurkishU.S. Virgin IslanderUgandanUkrainianUruguayanUteVenezuelanVietnameseWelshWest IndianYakamaYaquiYugoslavianYumanYup'ikZimbabwean
Immigration
NonimmigrantsImmigrantsAfghanistanAfricaAlbaniaArgentinaArmeniaAsiaAustraliaAustriaBahamasBangladeshBarbadosBelarusBelgiumBelizeBoliviaBosnia and HerzegovinaBrazilBulgariaBurma/MyanmarCabo VerdeCambodiaCameroonCanadaCaribbeanCentral AmericaChileChinaColombiaCongoCosta RicaCroatiaCubaCzechoslovakiaDenmarkDominicaDominican RepublicEastern AfricaEastern AsiaEastern EuropeEcuadorEgyptEl SalvadorEnglandEritreaEthiopiaEuropeFijiFranceGermanyGhanaGreeceGrenadaGuatemalaGuyanaHaitiHondurasHong KongHungaryIndiaIndonesiaIranIraqIrelandIsraelItalyJamaicaJapanKazakhstanKenyaKoreaKuwaitLaosLatin AmericaLatviaLebanonLiberiaLithuaniaMalaysiaMexicoMicronesiaMiddle AfricaMoldovaMoroccoNepalNetherlandsNicaraguaNigeriaNorth AmericaNorth MacedoniaNorthern AfricaNorthern EuropeNorwayOceaniaPakistanPanamaPeruPhilippinesPolandPortugalRomaniaRussiaSaudi ArabiaScotlandSenegalSerbiaSierra LeoneSingaporeSomaliaSouth AfricaSouth AmericaSouth Central AsiaSouth Eastern AsiaSouthern EuropeSpainSri LankaSt. Vincent and the GrenadinesSudanSwedenSwitzerlandSyriaTaiwanThailandTrinidad and TobagoTurkeyUgandaUkraineUruguayUzbekistanVenezuelaVietnamWest IndiesWestern AfricaWestern AsiaWestern EuropeYemenZaireZimbabweAzores
Median Household Income
Income
Poverty
Unemployment
Labor Participation
Family Structure
Vehicle Availability
Education Level
Disability

Median Household Income Comparison

Immigrants from Jordan

Creek

Exceptional
Tragic
$89,412
MEDIAN HOUSEHOLD INCOME
94.1/ 100
METRIC RATING
124th/ 347
METRIC RANK
$67,715
MEDIAN HOUSEHOLD INCOME
0.0/ 100
METRIC RATING
333rd/ 347
METRIC RANK

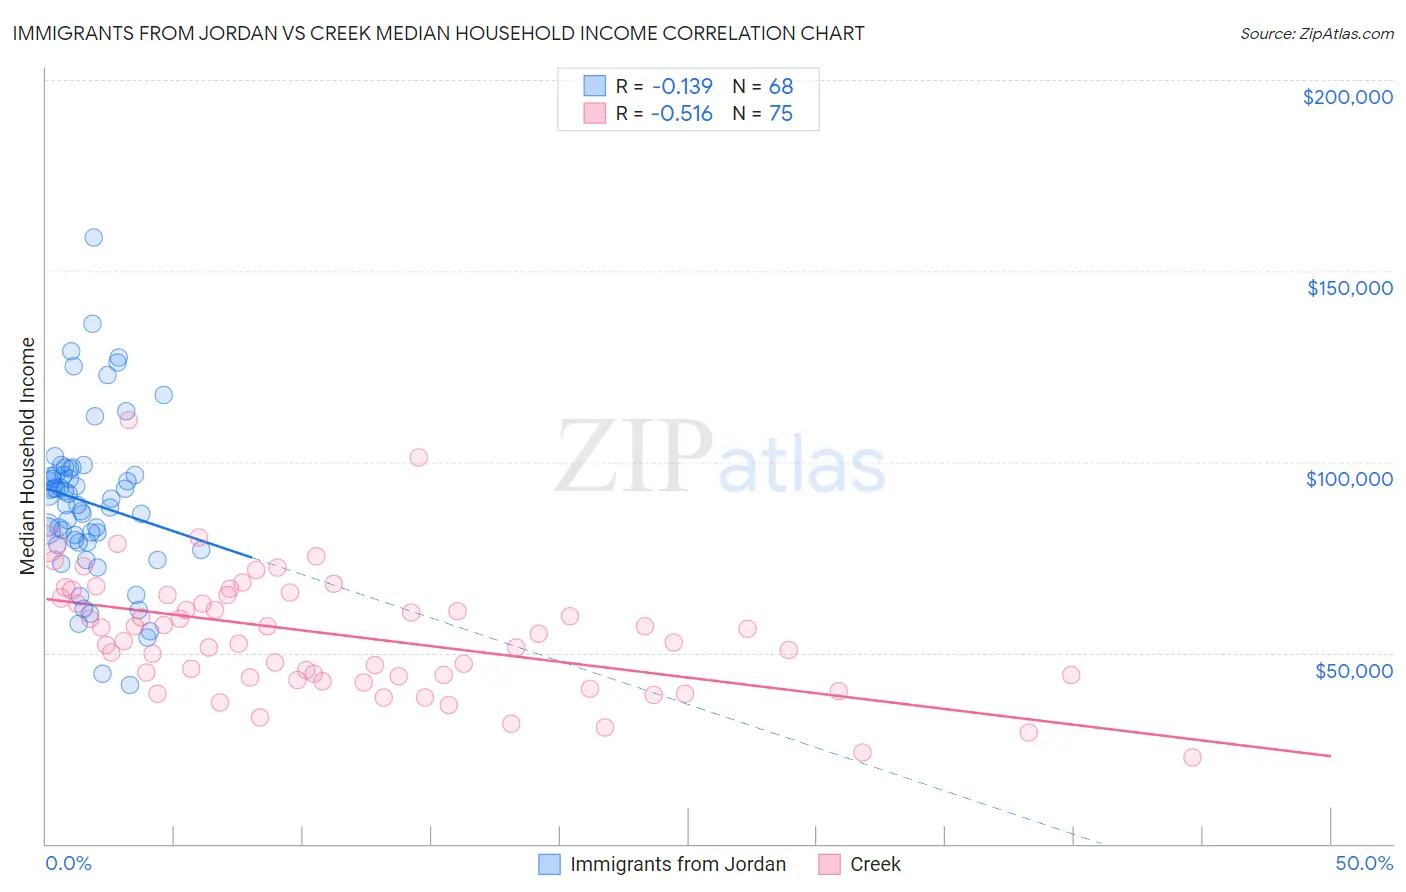
Immigrants from Jordan vs Creek Median Household Income Correlation Chart

The statistical analysis conducted on geographies consisting of 181,227,500 people shows a poor negative correlation between the proportion of Immigrants from Jordan and median household income in the United States with a correlation coefficient (R) of -0.139 and weighted average of $89,412. Similarly, the statistical analysis conducted on geographies consisting of 178,405,677 people shows a substantial negative correlation between the proportion of Creek and median household income in the United States with a correlation coefficient (R) of -0.516 and weighted average of $67,715, a difference of 32.0%.
Immigrants from Jordan vs Creek Median Household Income

Median Household Income Correlation Summary

MeasurementImmigrants from JordanCreek
Minimum$41,486$22,500
Maximum$158,906$111,063
Range$117,420$88,563
Mean$89,344$54,543
Median$89,581$53,166
Interquartile 25% (IQ1)$78,846$43,621
Interquartile 75% (IQ3)$96,669$65,130
Interquartile Range (IQR)$17,823$21,509
Standard Deviation (Sample)$21,166$15,915
Standard Deviation (Population)$21,010$15,809

Similar Demographics by Median Household Income

Demographics Similar to Immigrants from Jordan by Median Household Income

In terms of median household income, the demographic groups most similar to Immigrants from Jordan are Immigrants from Zimbabwe ($89,496, a difference of 0.090%), Immigrants from Kuwait ($89,263, a difference of 0.17%), Ethiopian ($89,640, a difference of 0.25%), Pakistani ($89,638, a difference of 0.25%), and Immigrants from Oceania ($89,100, a difference of 0.35%).
DemographicsRating | RankMedian Household Income
Taiwanese
95.6
/100
|
#117
Exceptional
$89,900
Syrians
95.4
/100
|
#118
Exceptional
$89,830
Albanians
95.2
/100
|
#119
Exceptional
$89,744
Immigrants | North Macedonia
95.2
/100
|
#120
Exceptional
$89,741
Ethiopians
94.9
/100
|
#121
Exceptional
$89,640
Pakistanis
94.8
/100
|
#122
Exceptional
$89,638
Immigrants | Zimbabwe
94.4
/100
|
#123
Exceptional
$89,496
Immigrants | Jordan
94.1
/100
|
#124
Exceptional
$89,412
Immigrants | Kuwait
93.5
/100
|
#125
Exceptional
$89,263
Immigrants | Oceania
92.9
/100
|
#126
Exceptional
$89,100
Immigrants | Peru
92.5
/100
|
#127
Exceptional
$89,010
Portuguese
92.3
/100
|
#128
Exceptional
$88,976
Brazilians
92.1
/100
|
#129
Exceptional
$88,934
British
92.0
/100
|
#130
Exceptional
$88,914
Immigrants | Syria
91.4
/100
|
#131
Exceptional
$88,792

Demographics Similar to Creek by Median Household Income

In terms of median household income, the demographic groups most similar to Creek are Sioux ($67,792, a difference of 0.11%), Black/African American ($67,573, a difference of 0.21%), Native/Alaskan ($67,879, a difference of 0.24%), Arapaho ($67,965, a difference of 0.37%), and Dutch West Indian ($68,412, a difference of 1.0%).
DemographicsRating | RankMedian Household Income
Yuman
0.0
/100
|
#326
Tragic
$68,743
Immigrants | Cuba
0.0
/100
|
#327
Tragic
$68,461
Menominee
0.0
/100
|
#328
Tragic
$68,423
Dutch West Indians
0.0
/100
|
#329
Tragic
$68,412
Arapaho
0.0
/100
|
#330
Tragic
$67,965
Natives/Alaskans
0.0
/100
|
#331
Tragic
$67,879
Sioux
0.0
/100
|
#332
Tragic
$67,792
Creek
0.0
/100
|
#333
Tragic
$67,715
Blacks/African Americans
0.0
/100
|
#334
Tragic
$67,573
Cheyenne
0.0
/100
|
#335
Tragic
$66,974
Immigrants | Congo
0.0
/100
|
#336
Tragic
$66,768
Kiowa
0.0
/100
|
#337
Tragic
$65,914
Immigrants | Yemen
0.0
/100
|
#338
Tragic
$65,194
Hopi
0.0
/100
|
#339
Tragic
$65,043
Pueblo
0.0
/100
|
#340
Tragic
$64,692