Immigrants from Japan vs Immigrants from Latin America Householder Income Ages 25 - 44 years
COMPARE
Immigrants from Japan
Immigrants from Latin America
Householder Income Ages 25 - 44 years
Householder Income Ages 25 - 44 years Comparison
Immigrants from Japan
Immigrants from Latin America
$112,228
HOUSEHOLDER INCOME AGES 25 - 44 YEARS
100.0/ 100
METRIC RATING
23rd/ 347
METRIC RANK
$82,166
HOUSEHOLDER INCOME AGES 25 - 44 YEARS
0.1/ 100
METRIC RATING
287th/ 347
METRIC RANK
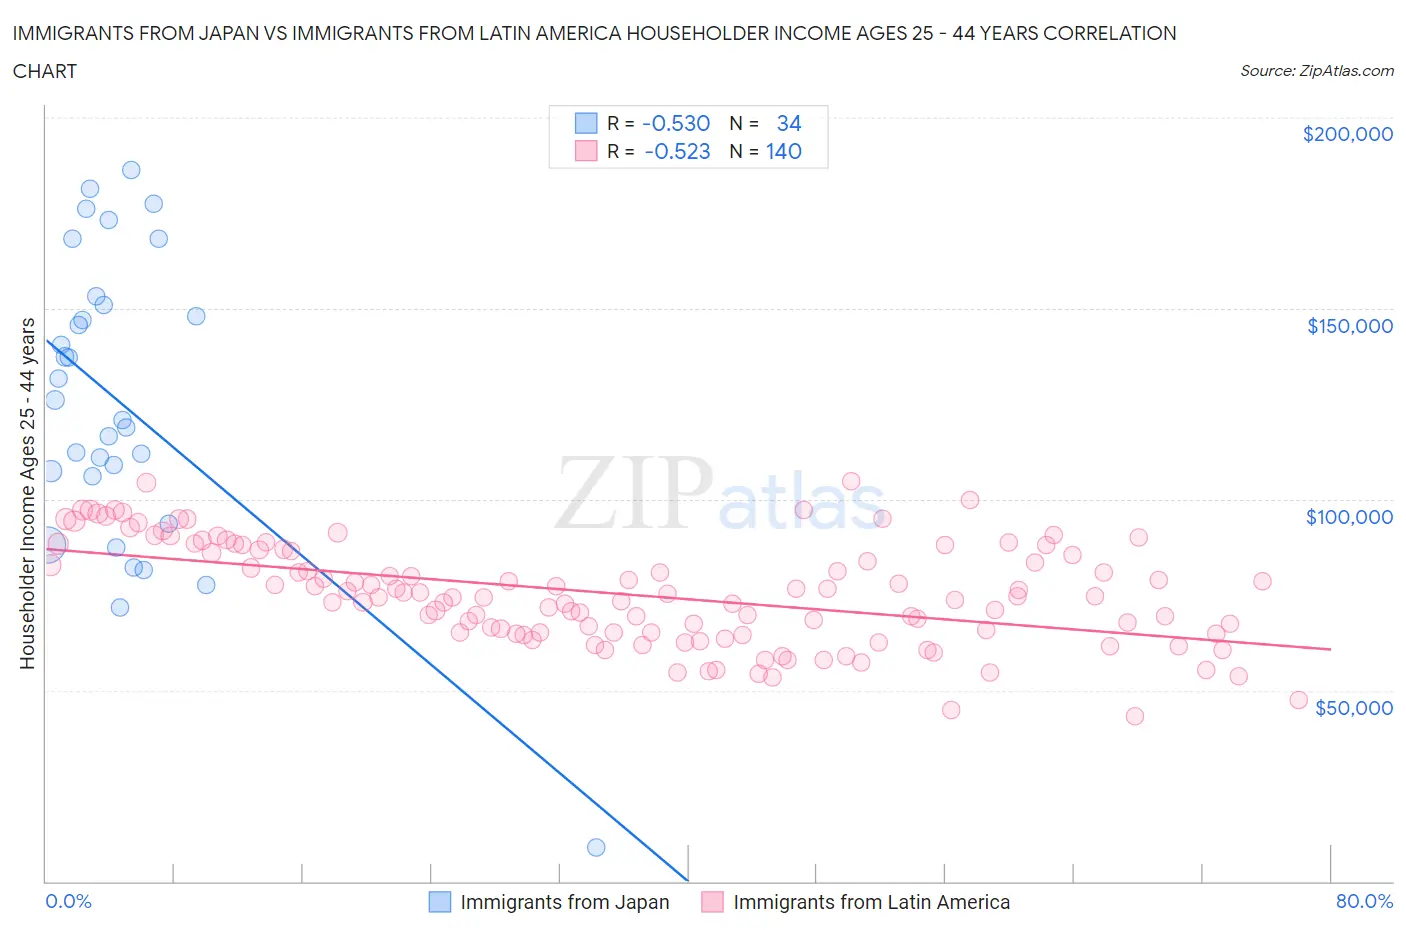
Immigrants from Japan vs Immigrants from Latin America Householder Income Ages 25 - 44 years Correlation Chart
The statistical analysis conducted on geographies consisting of 339,467,861 people shows a substantial negative correlation between the proportion of Immigrants from Japan and household income with householder between the ages 25 and 44 in the United States with a correlation coefficient (R) of -0.530 and weighted average of $112,228. Similarly, the statistical analysis conducted on geographies consisting of 553,849,176 people shows a substantial negative correlation between the proportion of Immigrants from Latin America and household income with householder between the ages 25 and 44 in the United States with a correlation coefficient (R) of -0.523 and weighted average of $82,166, a difference of 36.6%.
Householder Income Ages 25 - 44 years Correlation Summary
| Measurement | Immigrants from Japan | Immigrants from Latin America |
| Minimum | $8,816 | $43,333 |
| Maximum | $186,269 | $104,675 |
| Range | $177,453 | $61,342 |
| Mean | $125,080 | $75,262 |
| Median | $123,352 | $74,553 |
| Interquartile 25% (IQ1) | $106,100 | $65,072 |
| Interquartile 75% (IQ3) | $150,805 | $86,812 |
| Interquartile Range (IQR) | $44,706 | $21,740 |
| Standard Deviation (Sample) | $38,741 | $13,368 |
| Standard Deviation (Population) | $38,167 | $13,320 |
Similar Demographics by Householder Income Ages 25 - 44 years
Demographics Similar to Immigrants from Japan by Householder Income Ages 25 - 44 years
In terms of householder income ages 25 - 44 years, the demographic groups most similar to Immigrants from Japan are Immigrants from Sweden ($112,010, a difference of 0.19%), Immigrants from Belgium ($112,575, a difference of 0.31%), Asian ($112,666, a difference of 0.39%), Immigrants from Northern Europe ($111,676, a difference of 0.49%), and Immigrants from Korea ($113,401, a difference of 1.1%).
| Demographics | Rating | Rank | Householder Income Ages 25 - 44 years |
| Cypriots | 100.0 /100 | #16 | Exceptional $116,364 |
| Immigrants | Australia | 100.0 /100 | #17 | Exceptional $115,947 |
| Eastern Europeans | 100.0 /100 | #18 | Exceptional $114,523 |
| Burmese | 100.0 /100 | #19 | Exceptional $113,701 |
| Immigrants | Korea | 100.0 /100 | #20 | Exceptional $113,401 |
| Asians | 100.0 /100 | #21 | Exceptional $112,666 |
| Immigrants | Belgium | 100.0 /100 | #22 | Exceptional $112,575 |
| Immigrants | Japan | 100.0 /100 | #23 | Exceptional $112,228 |
| Immigrants | Sweden | 100.0 /100 | #24 | Exceptional $112,010 |
| Immigrants | Northern Europe | 100.0 /100 | #25 | Exceptional $111,676 |
| Immigrants | Asia | 100.0 /100 | #26 | Exceptional $110,787 |
| Russians | 100.0 /100 | #27 | Exceptional $110,398 |
| Immigrants | Denmark | 100.0 /100 | #28 | Exceptional $110,363 |
| Turks | 100.0 /100 | #29 | Exceptional $110,318 |
| Immigrants | Greece | 100.0 /100 | #30 | Exceptional $110,103 |
Demographics Similar to Immigrants from Latin America by Householder Income Ages 25 - 44 years
In terms of householder income ages 25 - 44 years, the demographic groups most similar to Immigrants from Latin America are Ute ($82,166, a difference of 0.0%), Comanche ($82,152, a difference of 0.020%), Immigrants from Somalia ($82,188, a difference of 0.030%), Immigrants from Middle Africa ($82,254, a difference of 0.11%), and Shoshone ($82,062, a difference of 0.13%).
| Demographics | Rating | Rank | Householder Income Ages 25 - 44 years |
| Colville | 0.1 /100 | #280 | Tragic $82,604 |
| Cajuns | 0.1 /100 | #281 | Tragic $82,393 |
| Central American Indians | 0.1 /100 | #282 | Tragic $82,355 |
| Guatemalans | 0.1 /100 | #283 | Tragic $82,331 |
| Immigrants | Middle Africa | 0.1 /100 | #284 | Tragic $82,254 |
| Immigrants | Somalia | 0.1 /100 | #285 | Tragic $82,188 |
| Ute | 0.1 /100 | #286 | Tragic $82,166 |
| Immigrants | Latin America | 0.1 /100 | #287 | Tragic $82,166 |
| Comanche | 0.1 /100 | #288 | Tragic $82,152 |
| Shoshone | 0.1 /100 | #289 | Tragic $82,062 |
| Liberians | 0.1 /100 | #290 | Tragic $82,005 |
| Potawatomi | 0.1 /100 | #291 | Tragic $81,774 |
| Yaqui | 0.1 /100 | #292 | Tragic $81,656 |
| Blackfeet | 0.1 /100 | #293 | Tragic $81,531 |
| Cubans | 0.1 /100 | #294 | Tragic $81,483 |