Immigrants from Japan vs Argentinean Median Earnings
COMPARE
Immigrants from Japan
Argentinean
Median Earnings
Median Earnings Comparison
Immigrants from Japan
Argentineans
$54,938
MEDIAN EARNINGS
100.0/ 100
METRIC RATING
18th/ 347
METRIC RANK
$50,399
MEDIAN EARNINGS
99.6/ 100
METRIC RATING
78th/ 347
METRIC RANK
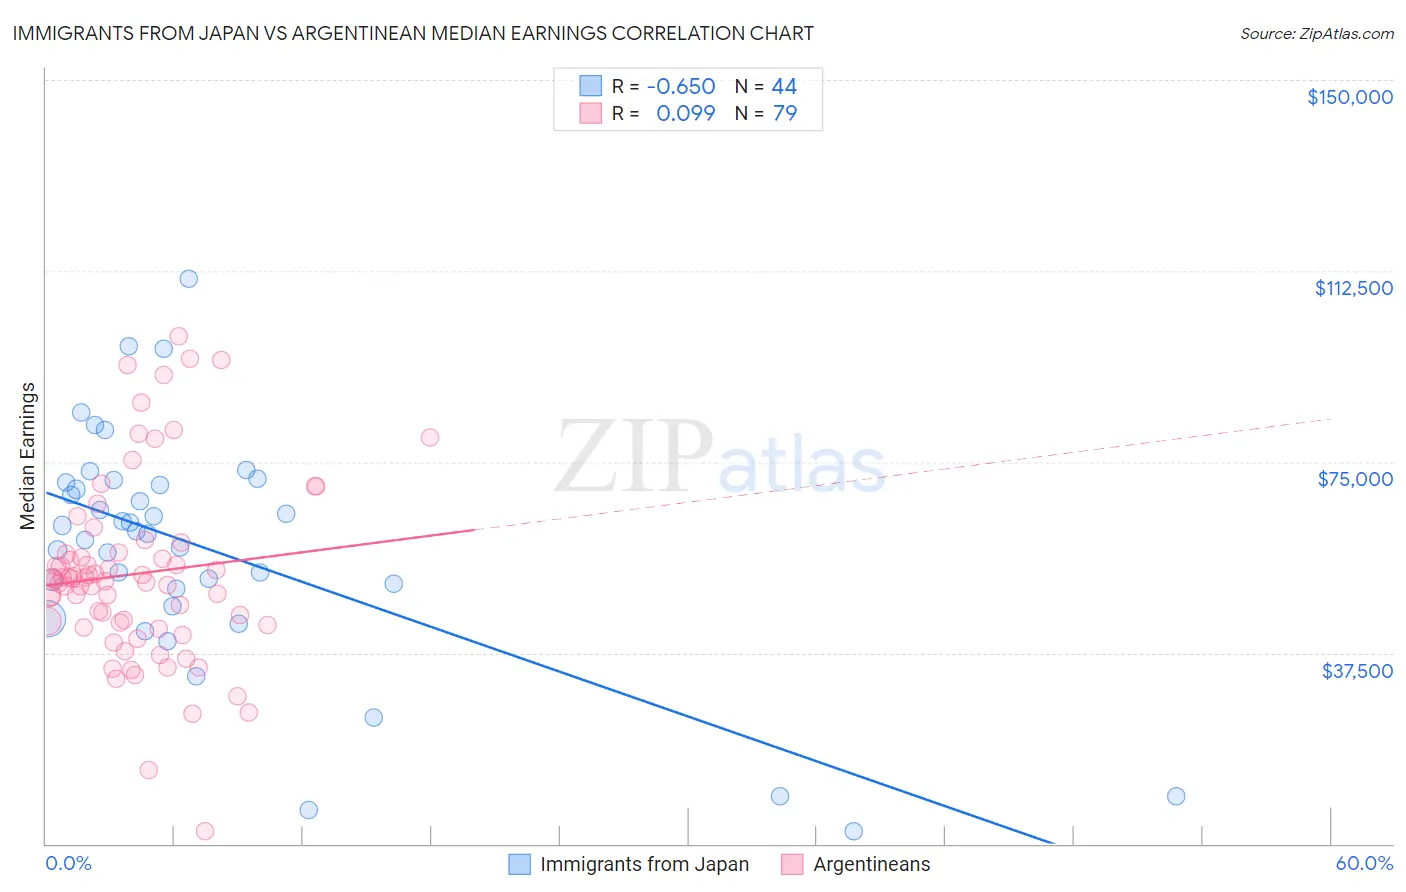
Immigrants from Japan vs Argentinean Median Earnings Correlation Chart
The statistical analysis conducted on geographies consisting of 340,132,421 people shows a significant negative correlation between the proportion of Immigrants from Japan and median earnings in the United States with a correlation coefficient (R) of -0.650 and weighted average of $54,938. Similarly, the statistical analysis conducted on geographies consisting of 297,136,392 people shows a slight positive correlation between the proportion of Argentineans and median earnings in the United States with a correlation coefficient (R) of 0.099 and weighted average of $50,399, a difference of 9.0%.
Median Earnings Correlation Summary
| Measurement | Immigrants from Japan | Argentinean |
| Minimum | $2,499 | $2,499 |
| Maximum | $110,893 | $99,706 |
| Range | $108,394 | $97,207 |
| Mean | $57,767 | $53,044 |
| Median | $61,115 | $51,898 |
| Interquartile 25% (IQ1) | $48,389 | $42,917 |
| Interquartile 75% (IQ3) | $70,647 | $57,109 |
| Interquartile Range (IQR) | $22,258 | $14,192 |
| Standard Deviation (Sample) | $23,135 | $18,063 |
| Standard Deviation (Population) | $22,870 | $17,948 |
Similar Demographics by Median Earnings
Demographics Similar to Immigrants from Japan by Median Earnings
In terms of median earnings, the demographic groups most similar to Immigrants from Japan are Eastern European ($55,084, a difference of 0.26%), Immigrants from Belgium ($54,679, a difference of 0.47%), Cypriot ($54,589, a difference of 0.64%), Burmese ($54,559, a difference of 0.69%), and Immigrants from Korea ($54,530, a difference of 0.75%).
| Demographics | Rating | Rank | Median Earnings |
| Immigrants | Israel | 100.0 /100 | #11 | Exceptional $57,034 |
| Immigrants | Ireland | 100.0 /100 | #12 | Exceptional $56,854 |
| Immigrants | China | 100.0 /100 | #13 | Exceptional $56,638 |
| Immigrants | Australia | 100.0 /100 | #14 | Exceptional $56,305 |
| Indians (Asian) | 100.0 /100 | #15 | Exceptional $56,253 |
| Immigrants | Eastern Asia | 100.0 /100 | #16 | Exceptional $56,183 |
| Eastern Europeans | 100.0 /100 | #17 | Exceptional $55,084 |
| Immigrants | Japan | 100.0 /100 | #18 | Exceptional $54,938 |
| Immigrants | Belgium | 100.0 /100 | #19 | Exceptional $54,679 |
| Cypriots | 100.0 /100 | #20 | Exceptional $54,589 |
| Burmese | 100.0 /100 | #21 | Exceptional $54,559 |
| Immigrants | Korea | 100.0 /100 | #22 | Exceptional $54,530 |
| Immigrants | Sweden | 100.0 /100 | #23 | Exceptional $54,478 |
| Soviet Union | 100.0 /100 | #24 | Exceptional $54,290 |
| Turks | 100.0 /100 | #25 | Exceptional $53,919 |
Demographics Similar to Argentineans by Median Earnings
In terms of median earnings, the demographic groups most similar to Argentineans are Laotian ($50,343, a difference of 0.11%), Ukrainian ($50,320, a difference of 0.16%), Immigrants from Southern Europe ($50,280, a difference of 0.24%), Immigrants from Moldova ($50,274, a difference of 0.25%), and Immigrants from Western Europe ($50,549, a difference of 0.30%).
| Demographics | Rating | Rank | Median Earnings |
| Immigrants | Ukraine | 99.8 /100 | #71 | Exceptional $50,984 |
| Immigrants | Egypt | 99.8 /100 | #72 | Exceptional $50,901 |
| Immigrants | Netherlands | 99.8 /100 | #73 | Exceptional $50,818 |
| South Africans | 99.8 /100 | #74 | Exceptional $50,752 |
| Immigrants | Scotland | 99.8 /100 | #75 | Exceptional $50,741 |
| Immigrants | Italy | 99.7 /100 | #76 | Exceptional $50,581 |
| Immigrants | Western Europe | 99.7 /100 | #77 | Exceptional $50,549 |
| Argentineans | 99.6 /100 | #78 | Exceptional $50,399 |
| Laotians | 99.6 /100 | #79 | Exceptional $50,343 |
| Ukrainians | 99.6 /100 | #80 | Exceptional $50,320 |
| Immigrants | Southern Europe | 99.6 /100 | #81 | Exceptional $50,280 |
| Immigrants | Moldova | 99.5 /100 | #82 | Exceptional $50,274 |
| Romanians | 99.5 /100 | #83 | Exceptional $50,244 |
| Immigrants | Hungary | 99.5 /100 | #84 | Exceptional $50,227 |
| Immigrants | Kazakhstan | 99.5 /100 | #85 | Exceptional $50,225 |