Immigrants from Jamaica vs Seminole Median Male Earnings
COMPARE
Immigrants from Jamaica
Seminole
Median Male Earnings
Median Male Earnings Comparison
Immigrants from Jamaica
Seminole
$48,040
MEDIAN MALE EARNINGS
0.2/ 100
METRIC RATING
283rd/ 347
METRIC RANK
$46,783
MEDIAN MALE EARNINGS
0.1/ 100
METRIC RATING
302nd/ 347
METRIC RANK
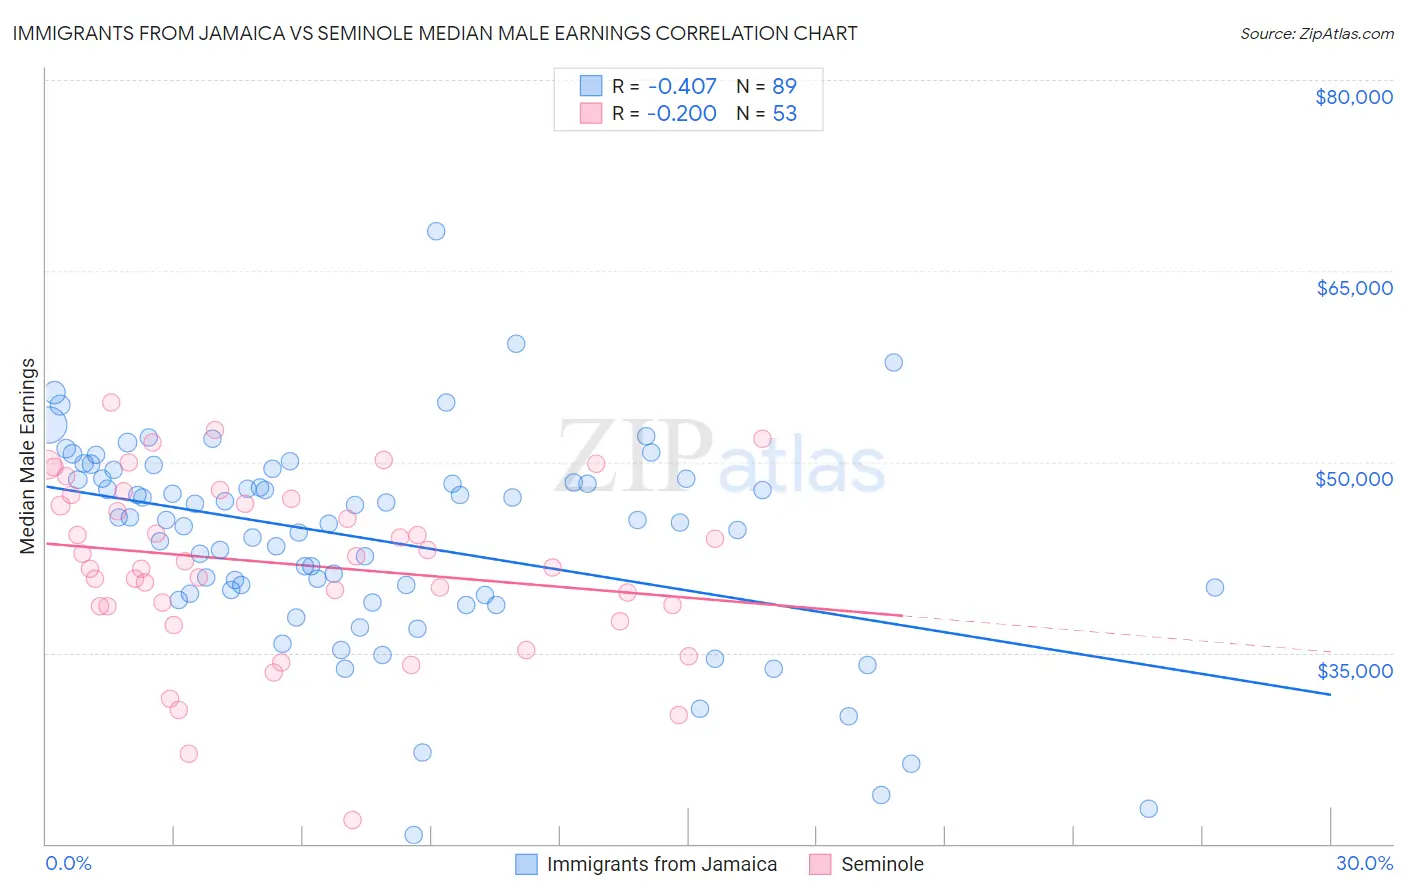
Immigrants from Jamaica vs Seminole Median Male Earnings Correlation Chart
The statistical analysis conducted on geographies consisting of 301,762,663 people shows a moderate negative correlation between the proportion of Immigrants from Jamaica and median male earnings in the United States with a correlation coefficient (R) of -0.407 and weighted average of $48,040. Similarly, the statistical analysis conducted on geographies consisting of 118,283,332 people shows a poor negative correlation between the proportion of Seminole and median male earnings in the United States with a correlation coefficient (R) of -0.200 and weighted average of $46,783, a difference of 2.7%.
Median Male Earnings Correlation Summary
| Measurement | Immigrants from Jamaica | Seminole |
| Minimum | $20,648 | $21,845 |
| Maximum | $68,125 | $54,701 |
| Range | $47,477 | $32,856 |
| Mean | $43,924 | $41,991 |
| Median | $45,397 | $42,165 |
| Interquartile 25% (IQ1) | $39,601 | $38,676 |
| Interquartile 75% (IQ3) | $48,697 | $47,251 |
| Interquartile Range (IQR) | $9,096 | $8,575 |
| Standard Deviation (Sample) | $8,088 | $6,861 |
| Standard Deviation (Population) | $8,042 | $6,796 |
Demographics Similar to Immigrants from Jamaica and Seminole by Median Male Earnings
In terms of median male earnings, the demographic groups most similar to Immigrants from Jamaica are African ($47,994, a difference of 0.090%), Paiute ($47,991, a difference of 0.10%), Mexican American Indian ($47,990, a difference of 0.10%), Central American ($48,093, a difference of 0.11%), and Immigrants from El Salvador ($47,973, a difference of 0.14%). Similarly, the demographic groups most similar to Seminole are Immigrants from Latin America ($46,941, a difference of 0.34%), Immigrants from Zaire ($47,070, a difference of 0.61%), U.S. Virgin Islander ($47,066, a difference of 0.61%), Immigrants from Micronesia ($47,177, a difference of 0.84%), and Dominican ($47,204, a difference of 0.90%).
| Demographics | Rating | Rank | Median Male Earnings |
| Central Americans | 0.2 /100 | #282 | Tragic $48,093 |
| Immigrants | Jamaica | 0.2 /100 | #283 | Tragic $48,040 |
| Africans | 0.2 /100 | #284 | Tragic $47,994 |
| Paiute | 0.2 /100 | #285 | Tragic $47,991 |
| Mexican American Indians | 0.2 /100 | #286 | Tragic $47,990 |
| Immigrants | El Salvador | 0.2 /100 | #287 | Tragic $47,973 |
| Shoshone | 0.2 /100 | #288 | Tragic $47,930 |
| Chickasaw | 0.1 /100 | #289 | Tragic $47,832 |
| Immigrants | Belize | 0.1 /100 | #290 | Tragic $47,809 |
| Choctaw | 0.1 /100 | #291 | Tragic $47,729 |
| Immigrants | Dominica | 0.1 /100 | #292 | Tragic $47,651 |
| Indonesians | 0.1 /100 | #293 | Tragic $47,503 |
| Immigrants | Nicaragua | 0.1 /100 | #294 | Tragic $47,482 |
| Central American Indians | 0.1 /100 | #295 | Tragic $47,433 |
| Inupiat | 0.1 /100 | #296 | Tragic $47,281 |
| Dominicans | 0.1 /100 | #297 | Tragic $47,204 |
| Immigrants | Micronesia | 0.1 /100 | #298 | Tragic $47,177 |
| Immigrants | Zaire | 0.1 /100 | #299 | Tragic $47,070 |
| U.S. Virgin Islanders | 0.1 /100 | #300 | Tragic $47,066 |
| Immigrants | Latin America | 0.1 /100 | #301 | Tragic $46,941 |
| Seminole | 0.1 /100 | #302 | Tragic $46,783 |