Immigrants from Jamaica vs Israeli Median Family Income
COMPARE
Immigrants from Jamaica
Israeli
Median Family Income
Median Family Income Comparison
Immigrants from Jamaica
Israelis
$89,268
MEDIAN FAMILY INCOME
0.1/ 100
METRIC RATING
277th/ 347
METRIC RANK
$118,577
MEDIAN FAMILY INCOME
100.0/ 100
METRIC RATING
36th/ 347
METRIC RANK
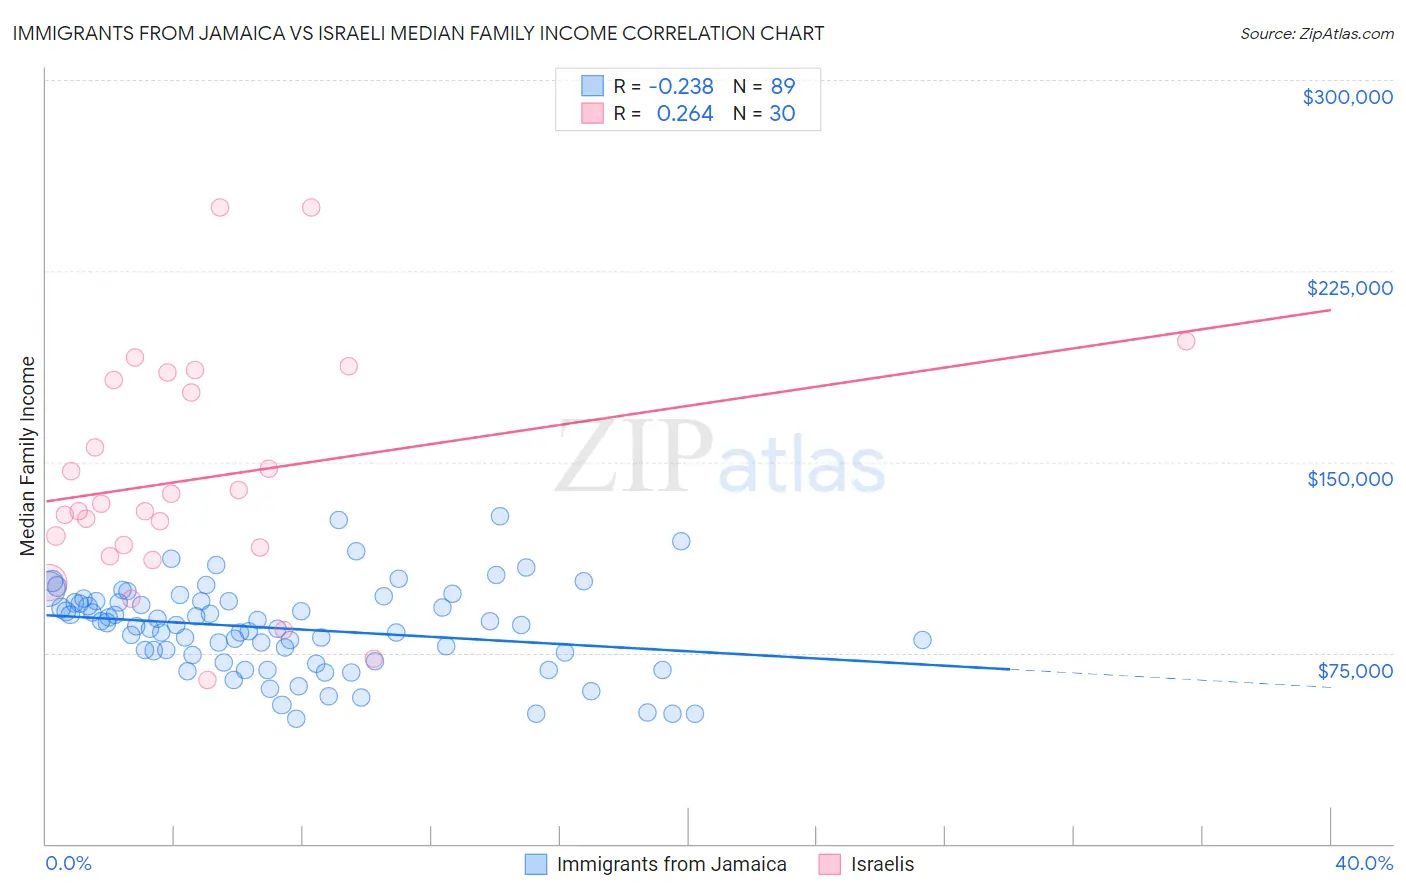
Immigrants from Jamaica vs Israeli Median Family Income Correlation Chart
The statistical analysis conducted on geographies consisting of 301,510,584 people shows a weak negative correlation between the proportion of Immigrants from Jamaica and median family income in the United States with a correlation coefficient (R) of -0.238 and weighted average of $89,268. Similarly, the statistical analysis conducted on geographies consisting of 210,932,899 people shows a weak positive correlation between the proportion of Israelis and median family income in the United States with a correlation coefficient (R) of 0.264 and weighted average of $118,577, a difference of 32.8%.
Median Family Income Correlation Summary
| Measurement | Immigrants from Jamaica | Israeli |
| Minimum | $49,200 | $64,441 |
| Maximum | $128,421 | $250,001 |
| Range | $79,221 | $185,560 |
| Mean | $84,512 | $143,645 |
| Median | $85,741 | $132,084 |
| Interquartile 25% (IQ1) | $72,845 | $116,332 |
| Interquartile 75% (IQ3) | $95,144 | $182,189 |
| Interquartile Range (IQR) | $22,299 | $65,857 |
| Standard Deviation (Sample) | $17,087 | $45,469 |
| Standard Deviation (Population) | $16,991 | $44,705 |
Similar Demographics by Median Family Income
Demographics Similar to Immigrants from Jamaica by Median Family Income
In terms of median family income, the demographic groups most similar to Immigrants from Jamaica are Immigrants from Zaire ($89,285, a difference of 0.020%), Immigrants from Grenada ($89,249, a difference of 0.020%), Immigrants from Belize ($89,197, a difference of 0.080%), British West Indian ($88,987, a difference of 0.32%), and Blackfeet ($88,717, a difference of 0.62%).
| Demographics | Rating | Rank | Median Family Income |
| Jamaicans | 0.2 /100 | #270 | Tragic $90,581 |
| Iroquois | 0.2 /100 | #271 | Tragic $90,543 |
| Immigrants | Liberia | 0.2 /100 | #272 | Tragic $90,450 |
| Immigrants | Micronesia | 0.2 /100 | #273 | Tragic $90,345 |
| Spanish Americans | 0.2 /100 | #274 | Tragic $90,322 |
| Immigrants | St. Vincent and the Grenadines | 0.2 /100 | #275 | Tragic $90,094 |
| Immigrants | Zaire | 0.1 /100 | #276 | Tragic $89,285 |
| Immigrants | Jamaica | 0.1 /100 | #277 | Tragic $89,268 |
| Immigrants | Grenada | 0.1 /100 | #278 | Tragic $89,249 |
| Immigrants | Belize | 0.1 /100 | #279 | Tragic $89,197 |
| British West Indians | 0.1 /100 | #280 | Tragic $88,987 |
| Blackfeet | 0.1 /100 | #281 | Tragic $88,717 |
| Comanche | 0.1 /100 | #282 | Tragic $88,556 |
| Bangladeshis | 0.1 /100 | #283 | Tragic $88,358 |
| Indonesians | 0.1 /100 | #284 | Tragic $88,301 |
Demographics Similar to Israelis by Median Family Income
In terms of median family income, the demographic groups most similar to Israelis are Australian ($118,440, a difference of 0.12%), Immigrants from Turkey ($118,325, a difference of 0.21%), Immigrants from Asia ($118,291, a difference of 0.24%), Immigrants from Lithuania ($118,053, a difference of 0.44%), and Estonian ($118,013, a difference of 0.48%).
| Demographics | Rating | Rank | Median Family Income |
| Latvians | 100.0 /100 | #29 | Exceptional $120,301 |
| Immigrants | Sri Lanka | 100.0 /100 | #30 | Exceptional $120,263 |
| Immigrants | France | 100.0 /100 | #31 | Exceptional $120,076 |
| Asians | 100.0 /100 | #32 | Exceptional $119,955 |
| Bhutanese | 100.0 /100 | #33 | Exceptional $119,800 |
| Bolivians | 100.0 /100 | #34 | Exceptional $119,479 |
| Soviet Union | 100.0 /100 | #35 | Exceptional $119,262 |
| Israelis | 100.0 /100 | #36 | Exceptional $118,577 |
| Australians | 100.0 /100 | #37 | Exceptional $118,440 |
| Immigrants | Turkey | 100.0 /100 | #38 | Exceptional $118,325 |
| Immigrants | Asia | 100.0 /100 | #39 | Exceptional $118,291 |
| Immigrants | Lithuania | 100.0 /100 | #40 | Exceptional $118,053 |
| Estonians | 100.0 /100 | #41 | Exceptional $118,013 |
| Immigrants | Bolivia | 100.0 /100 | #42 | Exceptional $117,912 |
| Bulgarians | 100.0 /100 | #43 | Exceptional $117,818 |