Immigrants from Jamaica vs Canadian Median Household Income
COMPARE
Immigrants from Jamaica
Canadian
Median Household Income
Median Household Income Comparison
Immigrants from Jamaica
Canadians
$75,851
MEDIAN HOUSEHOLD INCOME
0.3/ 100
METRIC RATING
268th/ 347
METRIC RANK
$87,769
MEDIAN HOUSEHOLD INCOME
84.7/ 100
METRIC RATING
142nd/ 347
METRIC RANK
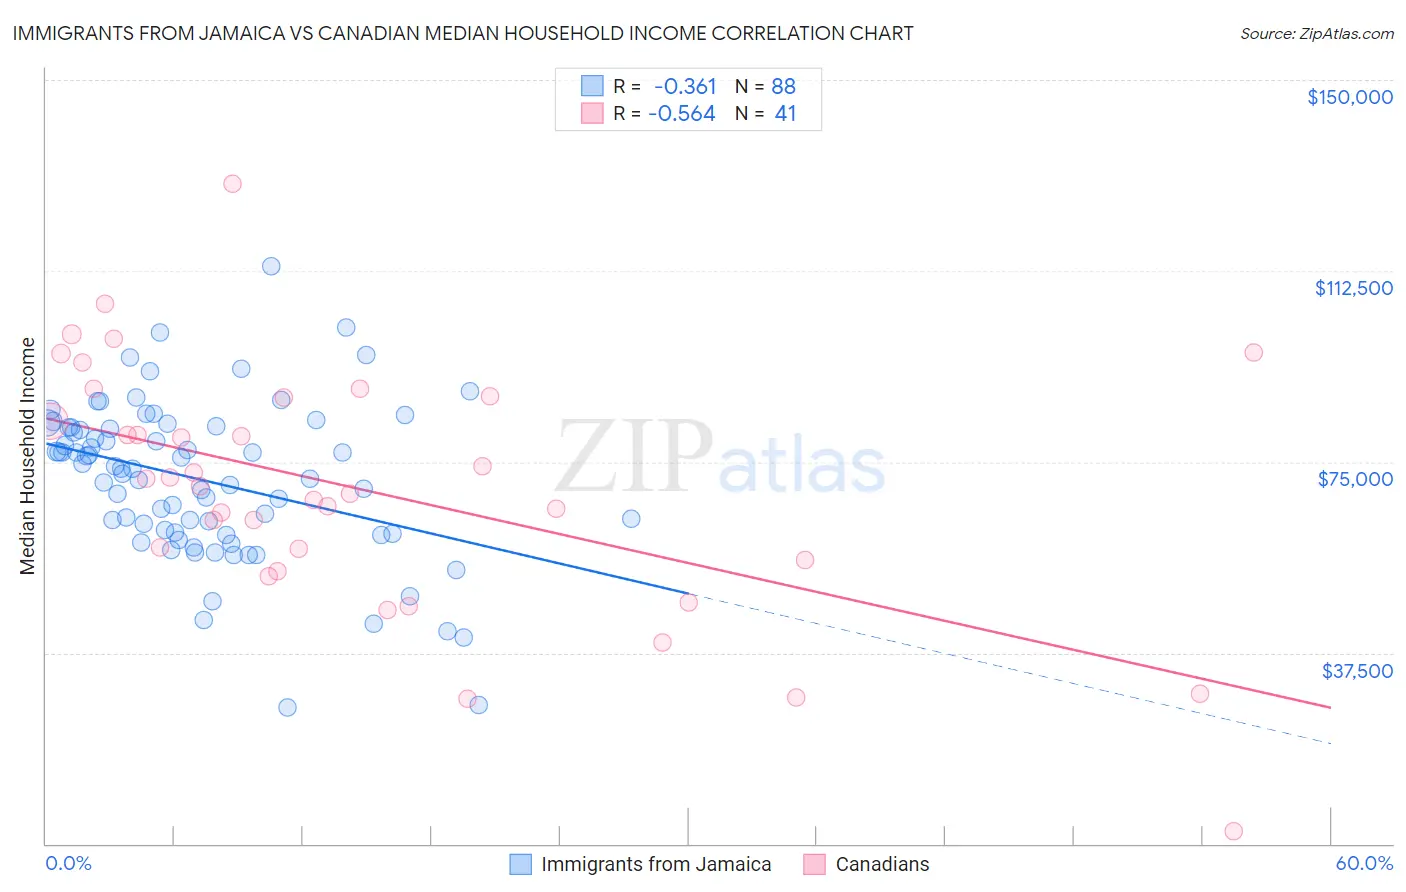
Immigrants from Jamaica vs Canadian Median Household Income Correlation Chart
The statistical analysis conducted on geographies consisting of 301,517,769 people shows a mild negative correlation between the proportion of Immigrants from Jamaica and median household income in the United States with a correlation coefficient (R) of -0.361 and weighted average of $75,851. Similarly, the statistical analysis conducted on geographies consisting of 437,190,973 people shows a substantial negative correlation between the proportion of Canadians and median household income in the United States with a correlation coefficient (R) of -0.564 and weighted average of $87,769, a difference of 15.7%.
Median Household Income Correlation Summary
| Measurement | Immigrants from Jamaica | Canadian |
| Minimum | $26,823 | $2,499 |
| Maximum | $113,462 | $129,644 |
| Range | $86,639 | $127,145 |
| Mean | $71,387 | $69,441 |
| Median | $73,716 | $70,262 |
| Interquartile 25% (IQ1) | $60,983 | $54,608 |
| Interquartile 75% (IQ3) | $81,782 | $87,722 |
| Interquartile Range (IQR) | $20,798 | $33,114 |
| Standard Deviation (Sample) | $15,538 | $24,486 |
| Standard Deviation (Population) | $15,449 | $24,185 |
Similar Demographics by Median Household Income
Demographics Similar to Immigrants from Jamaica by Median Household Income
In terms of median household income, the demographic groups most similar to Immigrants from Jamaica are Cape Verdean ($75,848, a difference of 0.0%), German Russian ($75,856, a difference of 0.010%), Hmong ($75,839, a difference of 0.020%), Pennsylvania German ($75,814, a difference of 0.050%), and Somali ($75,782, a difference of 0.090%).
| Demographics | Rating | Rank | Median Household Income |
| Immigrants | Grenada | 0.4 /100 | #261 | Tragic $76,517 |
| French American Indians | 0.4 /100 | #262 | Tragic $76,387 |
| Alaskan Athabascans | 0.4 /100 | #263 | Tragic $76,383 |
| Guatemalans | 0.3 /100 | #264 | Tragic $75,961 |
| Immigrants | Belize | 0.3 /100 | #265 | Tragic $75,938 |
| Americans | 0.3 /100 | #266 | Tragic $75,932 |
| German Russians | 0.3 /100 | #267 | Tragic $75,856 |
| Immigrants | Jamaica | 0.3 /100 | #268 | Tragic $75,851 |
| Cape Verdeans | 0.3 /100 | #269 | Tragic $75,848 |
| Hmong | 0.3 /100 | #270 | Tragic $75,839 |
| Pennsylvania Germans | 0.3 /100 | #271 | Tragic $75,814 |
| Somalis | 0.3 /100 | #272 | Tragic $75,782 |
| Liberians | 0.2 /100 | #273 | Tragic $75,667 |
| British West Indians | 0.2 /100 | #274 | Tragic $75,647 |
| Immigrants | Micronesia | 0.2 /100 | #275 | Tragic $75,574 |
Demographics Similar to Canadians by Median Household Income
In terms of median household income, the demographic groups most similar to Canadians are Danish ($87,676, a difference of 0.11%), Immigrants from Morocco ($87,930, a difference of 0.18%), Serbian ($87,572, a difference of 0.22%), Ugandan ($87,557, a difference of 0.24%), and Immigrants from Uganda ($87,553, a difference of 0.25%).
| Demographics | Rating | Rank | Median Household Income |
| Immigrants | Sierra Leone | 89.9 /100 | #135 | Excellent $88,498 |
| Poles | 89.7 /100 | #136 | Excellent $88,472 |
| Sierra Leoneans | 89.6 /100 | #137 | Excellent $88,463 |
| Arabs | 89.2 /100 | #138 | Excellent $88,398 |
| Immigrants | Chile | 89.2 /100 | #139 | Excellent $88,388 |
| Lebanese | 87.2 /100 | #140 | Excellent $88,091 |
| Immigrants | Morocco | 86.0 /100 | #141 | Excellent $87,930 |
| Canadians | 84.7 /100 | #142 | Excellent $87,769 |
| Danes | 83.9 /100 | #143 | Excellent $87,676 |
| Serbians | 83.0 /100 | #144 | Excellent $87,572 |
| Ugandans | 82.9 /100 | #145 | Excellent $87,557 |
| Immigrants | Uganda | 82.8 /100 | #146 | Excellent $87,553 |
| South American Indians | 81.8 /100 | #147 | Excellent $87,446 |
| Costa Ricans | 80.0 /100 | #148 | Excellent $87,262 |
| Immigrants | Nepal | 77.7 /100 | #149 | Good $87,046 |