Immigrants from Italy vs Albanian Median Earnings
COMPARE
Immigrants from Italy
Albanian
Median Earnings
Median Earnings Comparison
Immigrants from Italy
Albanians
$50,581
MEDIAN EARNINGS
99.7/ 100
METRIC RATING
76th/ 347
METRIC RANK
$50,116
MEDIAN EARNINGS
99.4/ 100
METRIC RATING
88th/ 347
METRIC RANK
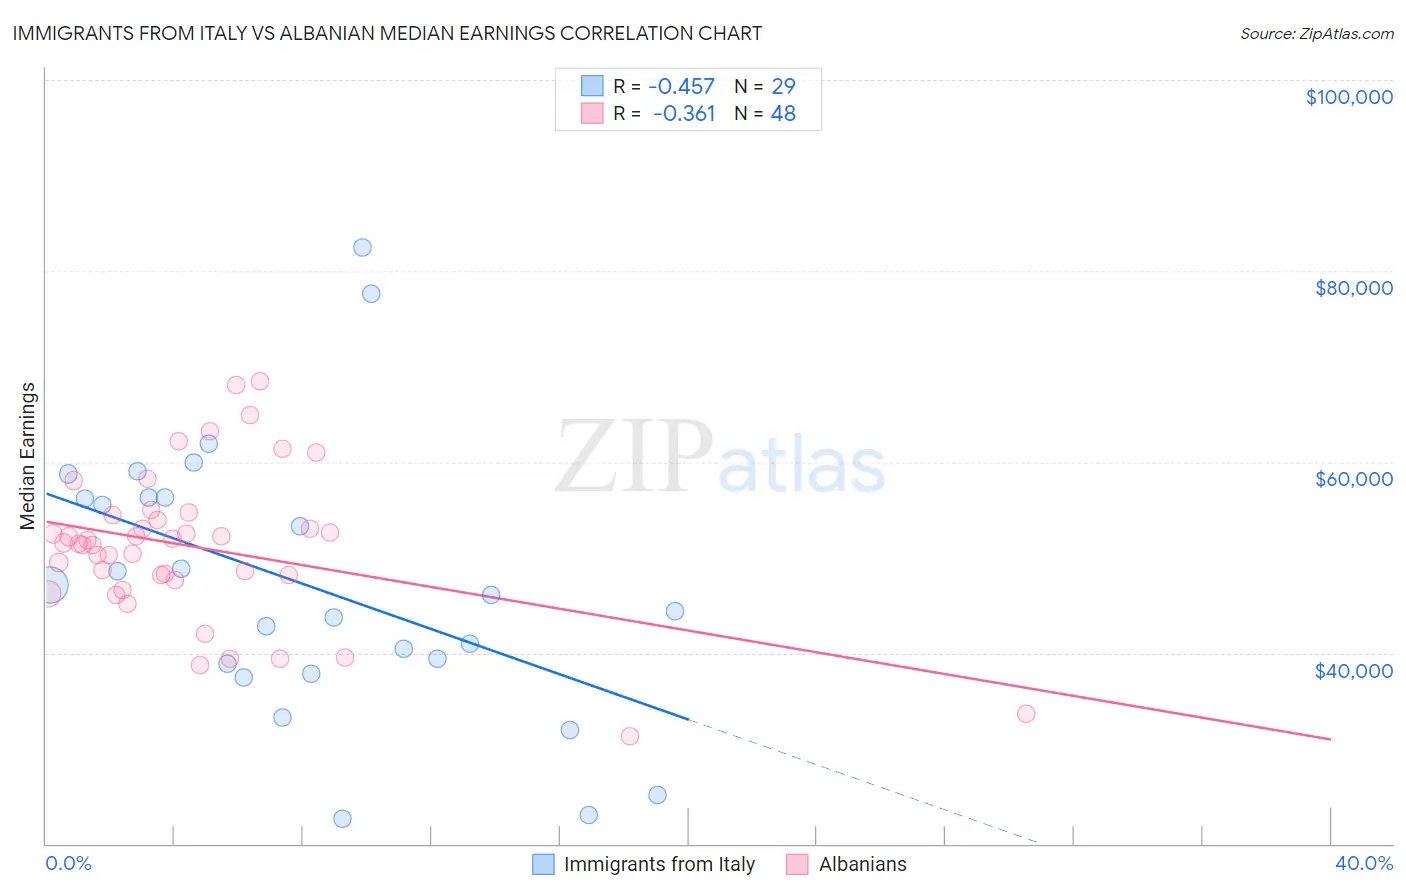
Immigrants from Italy vs Albanian Median Earnings Correlation Chart
The statistical analysis conducted on geographies consisting of 324,208,754 people shows a moderate negative correlation between the proportion of Immigrants from Italy and median earnings in the United States with a correlation coefficient (R) of -0.457 and weighted average of $50,581. Similarly, the statistical analysis conducted on geographies consisting of 193,255,601 people shows a mild negative correlation between the proportion of Albanians and median earnings in the United States with a correlation coefficient (R) of -0.361 and weighted average of $50,116, a difference of 0.93%.
Median Earnings Correlation Summary
| Measurement | Immigrants from Italy | Albanian |
| Minimum | $22,656 | $31,250 |
| Maximum | $82,450 | $68,474 |
| Range | $59,794 | $37,224 |
| Mean | $47,205 | $51,050 |
| Median | $46,000 | $51,491 |
| Interquartile 25% (IQ1) | $38,371 | $47,850 |
| Interquartile 75% (IQ3) | $56,217 | $54,177 |
| Interquartile Range (IQR) | $17,846 | $6,327 |
| Standard Deviation (Sample) | $14,283 | $7,882 |
| Standard Deviation (Population) | $14,035 | $7,799 |
Demographics Similar to Immigrants from Italy and Albanians by Median Earnings
In terms of median earnings, the demographic groups most similar to Immigrants from Italy are Immigrants from Western Europe ($50,549, a difference of 0.060%), Immigrants from Scotland ($50,741, a difference of 0.32%), South African ($50,752, a difference of 0.34%), Argentinean ($50,399, a difference of 0.36%), and Immigrants from Netherlands ($50,818, a difference of 0.47%). Similarly, the demographic groups most similar to Albanians are Immigrants from North America ($50,108, a difference of 0.020%), Immigrants from Uzbekistan ($50,151, a difference of 0.070%), Immigrants from Canada ($50,192, a difference of 0.15%), Immigrants from Hungary ($50,227, a difference of 0.22%), and Immigrants from Kazakhstan ($50,225, a difference of 0.22%).
| Demographics | Rating | Rank | Median Earnings |
| Immigrants | Egypt | 99.8 /100 | #72 | Exceptional $50,901 |
| Immigrants | Netherlands | 99.8 /100 | #73 | Exceptional $50,818 |
| South Africans | 99.8 /100 | #74 | Exceptional $50,752 |
| Immigrants | Scotland | 99.8 /100 | #75 | Exceptional $50,741 |
| Immigrants | Italy | 99.7 /100 | #76 | Exceptional $50,581 |
| Immigrants | Western Europe | 99.7 /100 | #77 | Exceptional $50,549 |
| Argentineans | 99.6 /100 | #78 | Exceptional $50,399 |
| Laotians | 99.6 /100 | #79 | Exceptional $50,343 |
| Ukrainians | 99.6 /100 | #80 | Exceptional $50,320 |
| Immigrants | Southern Europe | 99.6 /100 | #81 | Exceptional $50,280 |
| Immigrants | Moldova | 99.5 /100 | #82 | Exceptional $50,274 |
| Romanians | 99.5 /100 | #83 | Exceptional $50,244 |
| Immigrants | Hungary | 99.5 /100 | #84 | Exceptional $50,227 |
| Immigrants | Kazakhstan | 99.5 /100 | #85 | Exceptional $50,225 |
| Immigrants | Canada | 99.5 /100 | #86 | Exceptional $50,192 |
| Immigrants | Uzbekistan | 99.5 /100 | #87 | Exceptional $50,151 |
| Albanians | 99.4 /100 | #88 | Exceptional $50,116 |
| Immigrants | North America | 99.4 /100 | #89 | Exceptional $50,108 |
| Italians | 99.3 /100 | #90 | Exceptional $49,915 |
| Macedonians | 99.2 /100 | #91 | Exceptional $49,893 |
| Immigrants | Argentina | 99.2 /100 | #92 | Exceptional $49,841 |