Immigrants from Israel vs German Householder Income Over 65 years

COMPARE

Immigrants from Israel
Race
Ancestry
AfghanAfricanAlaska NativeAlaskan AthabascanAlbanianAleutAlsatianAmericanApacheArabArapahoArgentineanArmenianAssyrian/Chaldean/SyriacAustralianAustrianBahamianBangladeshiBarbadianBasqueBelgianBelizeanBermudanBhutaneseBlackfeetBolivianBrazilianBritishBritish West IndianBulgarianBurmeseCajunCambodianCanadianCape VerdeanCarpatho RusynCelticCentral AmericanCentral American IndianCherokeeCheyenneChickasawChileanChineseChippewaChoctawColombianColvilleComancheCosta RicanCreeCreekCroatianCrowCubanCypriotCzechCzechoslovakianDanishDelawareDominicanDutchDutch West IndianEastern EuropeanEcuadorianEgyptianEnglishEstonianEthiopianEuropeanFijianFilipinoFinnishFrenchFrench American IndianFrench CanadianGerman RussianGhanaianGreekGuamanian/ChamorroGuatemalanGuyaneseHaitianHmongHonduranHopiHoumaHungarianIcelanderIndian (Asian)IndonesianInupiatIranianIraqiIrishIroquoisIsraeliItalianJamaicanJapaneseJordanianKenyanKiowaKoreanLaotianLatvianLebaneseLiberianLithuanianLumbeeLuxembourgerMacedonianMalaysianMalteseMarshalleseMenomineeMexicanMexican American IndianMongolianMoroccanNative HawaiianNavajoNepaleseNew ZealanderNicaraguanNigerianNorthern EuropeanNorwegianOkinawanOsageOttawaPaiutePakistaniPalestinianPanamanianParaguayanPennsylvania GermanPeruvianPimaPolishPortuguesePotawatomiPuebloPuerto RicanPuget Sound SalishRomanianRussianSalvadoranSamoanScandinavianScotch-IrishScottishSeminoleSenegaleseSerbianShoshoneSierra LeoneanSiouxSlavicSlovakSloveneSomaliSouth AfricanSouth AmericanSouth American IndianSoviet UnionSpaniardSpanishSpanish AmericanSpanish American IndianSri LankanSubsaharan AfricanSudaneseSwedishSwissSyrianTaiwaneseThaiTlingit-HaidaTohono O'OdhamTonganTrinidadian and TobagonianTsimshianTurkishU.S. Virgin IslanderUgandanUkrainianUruguayanUteVenezuelanVietnameseWelshWest IndianYakamaYaquiYugoslavianYumanYup'ikZimbabwean
Immigration
NonimmigrantsImmigrantsAfghanistanAfricaAlbaniaArgentinaArmeniaAsiaAustraliaAustriaBahamasBangladeshBarbadosBelarusBelgiumBelizeBoliviaBosnia and HerzegovinaBrazilBulgariaBurma/MyanmarCabo VerdeCambodiaCameroonCanadaCaribbeanCentral AmericaChileChinaColombiaCongoCosta RicaCroatiaCubaCzechoslovakiaDenmarkDominicaDominican RepublicEastern AfricaEastern AsiaEastern EuropeEcuadorEgyptEl SalvadorEnglandEritreaEthiopiaEuropeFijiFranceGermanyGhanaGreeceGrenadaGuatemalaGuyanaHaitiHondurasHong KongHungaryIndiaIndonesiaIranIraqIrelandIsraelItalyJamaicaJapanJordanKazakhstanKenyaKoreaKuwaitLaosLatin AmericaLatviaLebanonLiberiaLithuaniaMalaysiaMexicoMicronesiaMiddle AfricaMoldovaMoroccoNepalNetherlandsNicaraguaNigeriaNorth AmericaNorth MacedoniaNorthern AfricaNorthern EuropeNorwayOceaniaPakistanPanamaPeruPhilippinesPolandPortugalRomaniaRussiaSaudi ArabiaScotlandSenegalSerbiaSierra LeoneSingaporeSomaliaSouth AfricaSouth AmericaSouth Central AsiaSouth Eastern AsiaSouthern EuropeSpainSri LankaSt. Vincent and the GrenadinesSudanSwedenSwitzerlandSyriaTaiwanThailandTrinidad and TobagoTurkeyUgandaUkraineUruguayUzbekistanVenezuelaVietnamWest IndiesWestern AfricaWestern AsiaWestern EuropeYemenZaireZimbabweAzores
German
Race
Ancestry
AfghanAfricanAlaska NativeAlaskan AthabascanAlbanianAleutAlsatianAmericanApacheArabArapahoArgentineanArmenianAssyrian/Chaldean/SyriacAustralianAustrianBahamianBangladeshiBarbadianBasqueBelgianBelizeanBermudanBhutaneseBlackfeetBolivianBrazilianBritishBritish West IndianBulgarianBurmeseCajunCambodianCanadianCape VerdeanCarpatho RusynCelticCentral AmericanCentral American IndianCherokeeCheyenneChickasawChileanChineseChippewaChoctawColombianColvilleComancheCosta RicanCreeCreekCroatianCrowCubanCypriotCzechCzechoslovakianDanishDelawareDominicanDutchDutch West IndianEastern EuropeanEcuadorianEgyptianEnglishEstonianEthiopianEuropeanFijianFilipinoFinnishFrenchFrench American IndianFrench CanadianGermanGerman RussianGhanaianGreekGuamanian/ChamorroGuatemalanGuyaneseHaitianHmongHonduranHopiHoumaHungarianIcelanderIndian (Asian)IndonesianInupiatIranianIraqiIrishIroquoisIsraeliItalianJamaicanJapaneseJordanianKenyanKiowaKoreanLaotianLatvianLebaneseLiberianLithuanianLumbeeLuxembourgerMacedonianMalaysianMalteseMarshalleseMenomineeMexicanMexican American IndianMongolianMoroccanNative HawaiianNavajoNepaleseNew ZealanderNicaraguanNigerianNorthern EuropeanNorwegianOkinawanOsageOttawaPaiutePakistaniPalestinianPanamanianParaguayanPennsylvania GermanPeruvianPimaPolishPortuguesePotawatomiPuebloPuerto RicanPuget Sound SalishRomanianRussianSalvadoranSamoanScandinavianScotch-IrishScottishSeminoleSenegaleseSerbianShoshoneSierra LeoneanSiouxSlavicSlovakSloveneSomaliSouth AfricanSouth AmericanSouth American IndianSoviet UnionSpaniardSpanishSpanish AmericanSpanish American IndianSri LankanSubsaharan AfricanSudaneseSwedishSwissSyrianTaiwaneseThaiTlingit-HaidaTohono O'OdhamTonganTrinidadian and TobagonianTsimshianTurkishU.S. Virgin IslanderUgandanUkrainianUruguayanUteVenezuelanVietnameseWelshWest IndianYakamaYaquiYugoslavianYumanYup'ikZimbabwean
Immigration
NonimmigrantsImmigrantsAfghanistanAfricaAlbaniaArgentinaArmeniaAsiaAustraliaAustriaBahamasBangladeshBarbadosBelarusBelgiumBelizeBoliviaBosnia and HerzegovinaBrazilBulgariaBurma/MyanmarCabo VerdeCambodiaCameroonCanadaCaribbeanCentral AmericaChileChinaColombiaCongoCosta RicaCroatiaCubaCzechoslovakiaDenmarkDominicaDominican RepublicEastern AfricaEastern AsiaEastern EuropeEcuadorEgyptEl SalvadorEnglandEritreaEthiopiaEuropeFijiFranceGermanyGhanaGreeceGrenadaGuatemalaGuyanaHaitiHondurasHong KongHungaryIndiaIndonesiaIranIraqIrelandItalyJamaicaJapanJordanKazakhstanKenyaKoreaKuwaitLaosLatin AmericaLatviaLebanonLiberiaLithuaniaMalaysiaMexicoMicronesiaMiddle AfricaMoldovaMoroccoNepalNetherlandsNicaraguaNigeriaNorth AmericaNorth MacedoniaNorthern AfricaNorthern EuropeNorwayOceaniaPakistanPanamaPeruPhilippinesPolandPortugalRomaniaRussiaSaudi ArabiaScotlandSenegalSerbiaSierra LeoneSingaporeSomaliaSouth AfricaSouth AmericaSouth Central AsiaSouth Eastern AsiaSouthern EuropeSpainSri LankaSt. Vincent and the GrenadinesSudanSwedenSwitzerlandSyriaTaiwanThailandTrinidad and TobagoTurkeyUgandaUkraineUruguayUzbekistanVenezuelaVietnamWest IndiesWestern AfricaWestern AsiaWestern EuropeYemenZaireZimbabweAzores
Householder Income Over 65 years
Income
Poverty
Unemployment
Labor Participation
Family Structure
Vehicle Availability
Education Level
Disability

Householder Income Over 65 years Comparison

Immigrants from Israel

Germans

Exceptional
Fair
$69,857
HOUSEHOLDER INCOME OVER 65 YEARS
100.0/ 100
METRIC RATING
22nd/ 347
METRIC RANK
$59,730
HOUSEHOLDER INCOME OVER 65 YEARS
21.5/ 100
METRIC RATING
196th/ 347
METRIC RANK

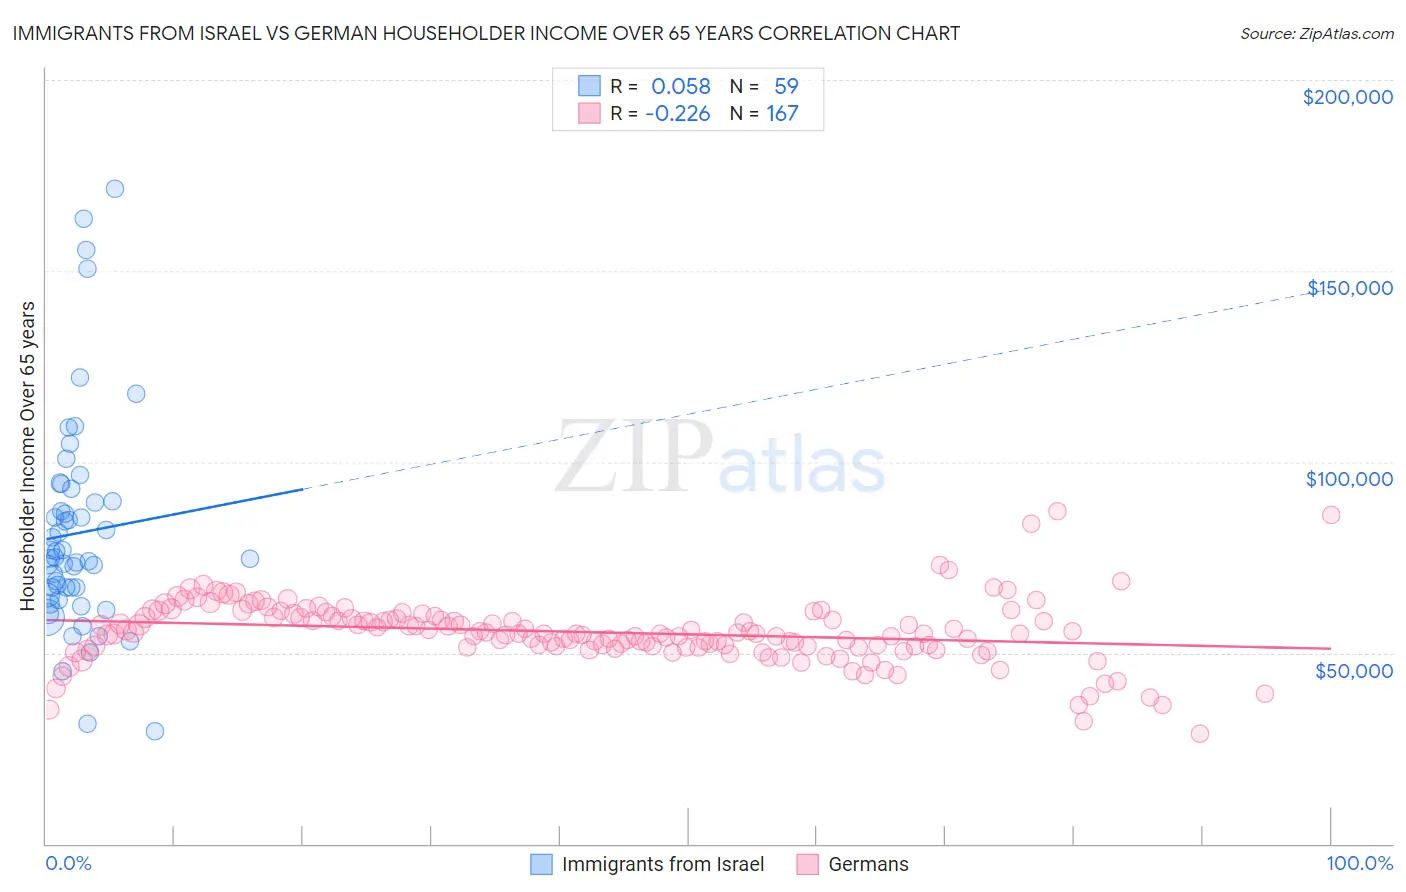
Immigrants from Israel vs German Householder Income Over 65 years Correlation Chart

The statistical analysis conducted on geographies consisting of 209,649,520 people shows a slight positive correlation between the proportion of Immigrants from Israel and household income with householder over the age of 65 in the United States with a correlation coefficient (R) of 0.058 and weighted average of $69,857. Similarly, the statistical analysis conducted on geographies consisting of 574,269,506 people shows a weak negative correlation between the proportion of Germans and household income with householder over the age of 65 in the United States with a correlation coefficient (R) of -0.226 and weighted average of $59,730, a difference of 17.0%.
Immigrants from Israel vs German Householder Income Over 65 years

Householder Income Over 65 years Correlation Summary

MeasurementImmigrants from IsraelGerman
Minimum$29,457$28,750
Maximum$171,563$86,983
Range$142,106$58,233
Mean$81,354$55,396
Median$74,737$55,057
Interquartile 25% (IQ1)$65,166$51,633
Interquartile 75% (IQ3)$89,688$59,523
Interquartile Range (IQR)$24,522$7,890
Standard Deviation (Sample)$28,278$8,316
Standard Deviation (Population)$28,038$8,291

Similar Demographics by Householder Income Over 65 years

Demographics Similar to Immigrants from Israel by Householder Income Over 65 years

In terms of householder income over 65 years, the demographic groups most similar to Immigrants from Israel are Immigrants from Eastern Asia ($69,872, a difference of 0.020%), Immigrants from Japan ($69,774, a difference of 0.12%), Immigrants from Sweden ($69,722, a difference of 0.19%), Immigrants from Belgium ($69,703, a difference of 0.22%), and Immigrants from South Central Asia ($70,103, a difference of 0.35%).
DemographicsRating | RankHouseholder Income Over 65 years
Native Hawaiians
100.0
/100
|
#15
Exceptional
$71,021
Okinawans
100.0
/100
|
#16
Exceptional
$70,846
Immigrants | Korea
100.0
/100
|
#17
Exceptional
$70,696
Eastern Europeans
100.0
/100
|
#18
Exceptional
$70,470
Indians (Asian)
100.0
/100
|
#19
Exceptional
$70,238
Immigrants | South Central Asia
100.0
/100
|
#20
Exceptional
$70,103
Immigrants | Eastern Asia
100.0
/100
|
#21
Exceptional
$69,872
Immigrants | Israel
100.0
/100
|
#22
Exceptional
$69,857
Immigrants | Japan
100.0
/100
|
#23
Exceptional
$69,774
Immigrants | Sweden
100.0
/100
|
#24
Exceptional
$69,722
Immigrants | Belgium
100.0
/100
|
#25
Exceptional
$69,703
Immigrants | Sri Lanka
100.0
/100
|
#26
Exceptional
$69,426
Immigrants | Switzerland
100.0
/100
|
#27
Exceptional
$69,343
Immigrants | China
100.0
/100
|
#28
Exceptional
$69,174
Immigrants | Australia
100.0
/100
|
#29
Exceptional
$69,164

Demographics Similar to Germans by Householder Income Over 65 years

In terms of householder income over 65 years, the demographic groups most similar to Germans are Immigrants from Kenya ($59,710, a difference of 0.030%), Moroccan ($59,683, a difference of 0.080%), Immigrants ($59,656, a difference of 0.12%), French ($59,656, a difference of 0.12%), and Immigrants from Iraq ($59,824, a difference of 0.16%).
DemographicsRating | RankHouseholder Income Over 65 years
Ghanaians
27.5
/100
|
#189
Fair
$60,043
Puget Sound Salish
25.3
/100
|
#190
Fair
$59,934
Belgians
24.9
/100
|
#191
Fair
$59,915
South Americans
23.8
/100
|
#192
Fair
$59,854
Immigrants | Costa Rica
23.6
/100
|
#193
Fair
$59,848
Immigrants | Africa
23.4
/100
|
#194
Fair
$59,837
Immigrants | Iraq
23.2
/100
|
#195
Fair
$59,824
Germans
21.5
/100
|
#196
Fair
$59,730
Immigrants | Kenya
21.1
/100
|
#197
Fair
$59,710
Moroccans
20.7
/100
|
#198
Fair
$59,683
Immigrants | Immigrants
20.2
/100
|
#199
Fair
$59,656
French
20.2
/100
|
#200
Fair
$59,656
Dutch
18.3
/100
|
#201
Poor
$59,539
Finns
18.2
/100
|
#202
Poor
$59,535
Scotch-Irish
16.9
/100
|
#203
Poor
$59,447