Immigrants from Israel vs Bhutanese Median Family Income
COMPARE
Immigrants from Israel
Bhutanese
Median Family Income
Median Family Income Comparison
Immigrants from Israel
Bhutanese
$127,430
MEDIAN FAMILY INCOME
100.0/ 100
METRIC RATING
11th/ 347
METRIC RANK
$119,800
MEDIAN FAMILY INCOME
100.0/ 100
METRIC RATING
33rd/ 347
METRIC RANK
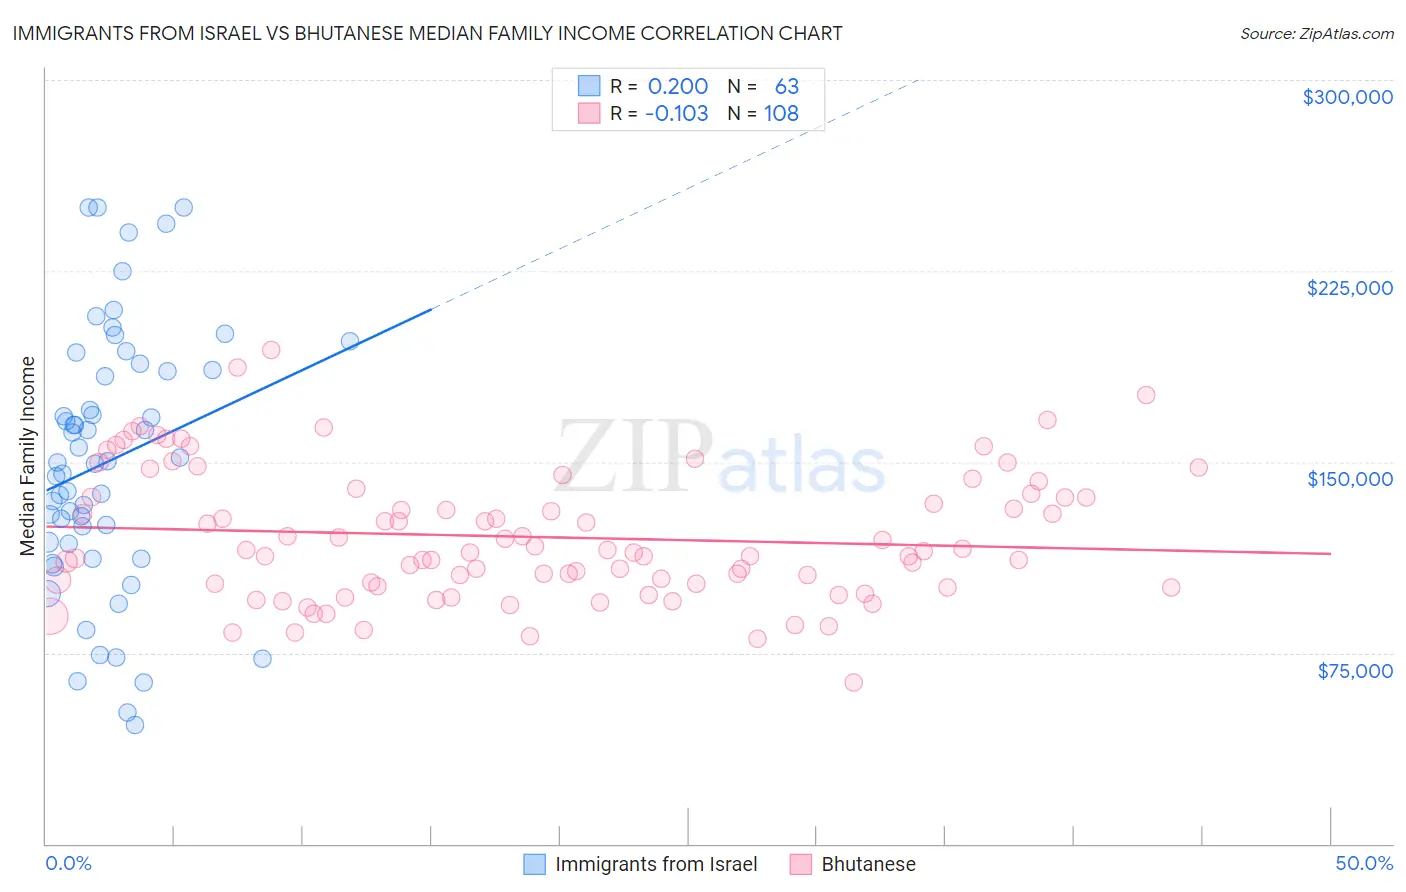
Immigrants from Israel vs Bhutanese Median Family Income Correlation Chart
The statistical analysis conducted on geographies consisting of 209,964,659 people shows a weak positive correlation between the proportion of Immigrants from Israel and median family income in the United States with a correlation coefficient (R) of 0.200 and weighted average of $127,430. Similarly, the statistical analysis conducted on geographies consisting of 454,953,353 people shows a poor negative correlation between the proportion of Bhutanese and median family income in the United States with a correlation coefficient (R) of -0.103 and weighted average of $119,800, a difference of 6.4%.
Median Family Income Correlation Summary
| Measurement | Immigrants from Israel | Bhutanese |
| Minimum | $46,719 | $63,382 |
| Maximum | $250,001 | $194,165 |
| Range | $203,282 | $130,783 |
| Mean | $150,105 | $120,532 |
| Median | $149,830 | $114,614 |
| Interquartile 25% (IQ1) | $117,916 | $101,662 |
| Interquartile 75% (IQ3) | $185,912 | $136,845 |
| Interquartile Range (IQR) | $67,996 | $35,183 |
| Standard Deviation (Sample) | $50,555 | $25,704 |
| Standard Deviation (Population) | $50,152 | $25,585 |
Similar Demographics by Median Family Income
Demographics Similar to Immigrants from Israel by Median Family Income
In terms of median family income, the demographic groups most similar to Immigrants from Israel are Immigrants from Ireland ($127,584, a difference of 0.12%), Cypriot ($127,064, a difference of 0.29%), Immigrants from Australia ($126,620, a difference of 0.64%), Immigrants from South Central Asia ($125,956, a difference of 1.2%), and Eastern European ($125,546, a difference of 1.5%).
| Demographics | Rating | Rank | Median Family Income |
| Immigrants | India | 100.0 /100 | #4 | Exceptional $134,028 |
| Iranians | 100.0 /100 | #5 | Exceptional $133,839 |
| Thais | 100.0 /100 | #6 | Exceptional $131,281 |
| Immigrants | Hong Kong | 100.0 /100 | #7 | Exceptional $131,067 |
| Immigrants | Iran | 100.0 /100 | #8 | Exceptional $130,894 |
| Okinawans | 100.0 /100 | #9 | Exceptional $129,979 |
| Immigrants | Ireland | 100.0 /100 | #10 | Exceptional $127,584 |
| Immigrants | Israel | 100.0 /100 | #11 | Exceptional $127,430 |
| Cypriots | 100.0 /100 | #12 | Exceptional $127,064 |
| Immigrants | Australia | 100.0 /100 | #13 | Exceptional $126,620 |
| Immigrants | South Central Asia | 100.0 /100 | #14 | Exceptional $125,956 |
| Eastern Europeans | 100.0 /100 | #15 | Exceptional $125,546 |
| Immigrants | China | 100.0 /100 | #16 | Exceptional $125,540 |
| Indians (Asian) | 100.0 /100 | #17 | Exceptional $125,312 |
| Immigrants | Eastern Asia | 100.0 /100 | #18 | Exceptional $125,150 |
Demographics Similar to Bhutanese by Median Family Income
In terms of median family income, the demographic groups most similar to Bhutanese are Asian ($119,955, a difference of 0.13%), Immigrants from France ($120,076, a difference of 0.23%), Bolivian ($119,479, a difference of 0.27%), Immigrants from Sri Lanka ($120,263, a difference of 0.39%), and Latvian ($120,301, a difference of 0.42%).
| Demographics | Rating | Rank | Median Family Income |
| Immigrants | Switzerland | 100.0 /100 | #26 | Exceptional $120,726 |
| Russians | 100.0 /100 | #27 | Exceptional $120,487 |
| Immigrants | Denmark | 100.0 /100 | #28 | Exceptional $120,445 |
| Latvians | 100.0 /100 | #29 | Exceptional $120,301 |
| Immigrants | Sri Lanka | 100.0 /100 | #30 | Exceptional $120,263 |
| Immigrants | France | 100.0 /100 | #31 | Exceptional $120,076 |
| Asians | 100.0 /100 | #32 | Exceptional $119,955 |
| Bhutanese | 100.0 /100 | #33 | Exceptional $119,800 |
| Bolivians | 100.0 /100 | #34 | Exceptional $119,479 |
| Soviet Union | 100.0 /100 | #35 | Exceptional $119,262 |
| Israelis | 100.0 /100 | #36 | Exceptional $118,577 |
| Australians | 100.0 /100 | #37 | Exceptional $118,440 |
| Immigrants | Turkey | 100.0 /100 | #38 | Exceptional $118,325 |
| Immigrants | Asia | 100.0 /100 | #39 | Exceptional $118,291 |
| Immigrants | Lithuania | 100.0 /100 | #40 | Exceptional $118,053 |