Immigrants from Ireland vs Pakistani Per Capita Income
COMPARE
Immigrants from Ireland
Pakistani
Per Capita Income
Per Capita Income Comparison
Immigrants from Ireland
Pakistanis
$56,584
PER CAPITA INCOME
100.0/ 100
METRIC RATING
9th/ 347
METRIC RANK
$45,587
PER CAPITA INCOME
89.7/ 100
METRIC RATING
133rd/ 347
METRIC RANK
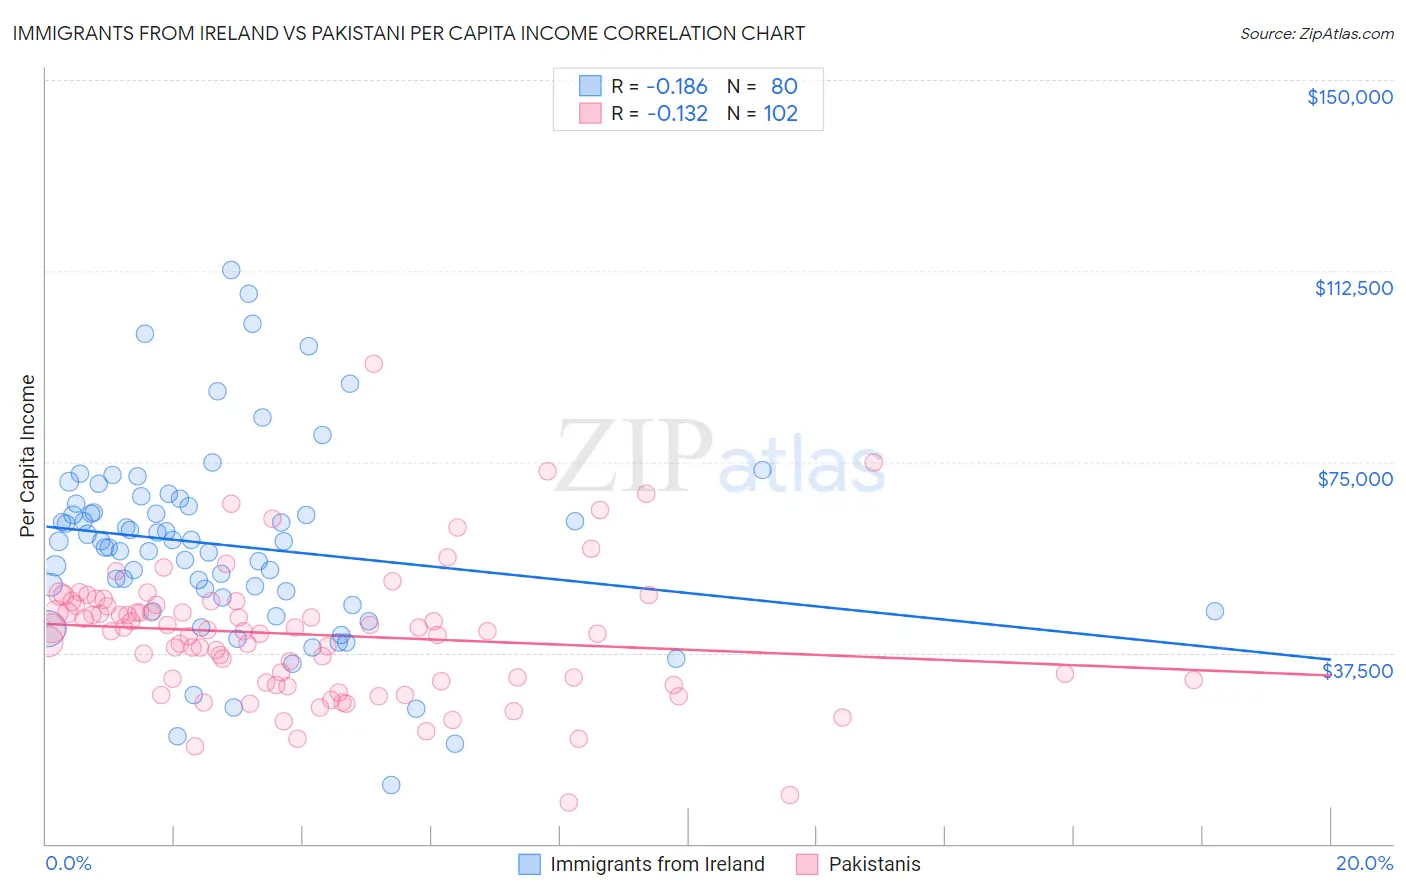
Immigrants from Ireland vs Pakistani Per Capita Income Correlation Chart
The statistical analysis conducted on geographies consisting of 240,778,427 people shows a poor negative correlation between the proportion of Immigrants from Ireland and per capita income in the United States with a correlation coefficient (R) of -0.186 and weighted average of $56,584. Similarly, the statistical analysis conducted on geographies consisting of 335,371,609 people shows a poor negative correlation between the proportion of Pakistanis and per capita income in the United States with a correlation coefficient (R) of -0.132 and weighted average of $45,587, a difference of 24.1%.
Per Capita Income Correlation Summary
| Measurement | Immigrants from Ireland | Pakistani |
| Minimum | $11,481 | $8,026 |
| Maximum | $112,628 | $94,275 |
| Range | $101,147 | $86,249 |
| Mean | $58,619 | $41,080 |
| Median | $59,294 | $41,744 |
| Interquartile 25% (IQ1) | $47,629 | $31,965 |
| Interquartile 75% (IQ3) | $66,537 | $46,855 |
| Interquartile Range (IQR) | $18,908 | $14,890 |
| Standard Deviation (Sample) | $19,021 | $13,251 |
| Standard Deviation (Population) | $18,902 | $13,186 |
Similar Demographics by Per Capita Income
Demographics Similar to Immigrants from Ireland by Per Capita Income
In terms of per capita income, the demographic groups most similar to Immigrants from Ireland are Immigrants from Hong Kong ($56,709, a difference of 0.22%), Okinawan ($55,817, a difference of 1.4%), Immigrants from Israel ($57,384, a difference of 1.4%), Eastern European ($55,780, a difference of 1.4%), and Immigrants from Sweden ($55,582, a difference of 1.8%).
| Demographics | Rating | Rank | Per Capita Income |
| Iranians | 100.0 /100 | #2 | Exceptional $58,786 |
| Immigrants | Singapore | 100.0 /100 | #3 | Exceptional $58,353 |
| Immigrants | Australia | 100.0 /100 | #4 | Exceptional $57,953 |
| Immigrants | Iran | 100.0 /100 | #5 | Exceptional $57,759 |
| Immigrants | Taiwan | 100.0 /100 | #6 | Exceptional $57,742 |
| Immigrants | Israel | 100.0 /100 | #7 | Exceptional $57,384 |
| Immigrants | Hong Kong | 100.0 /100 | #8 | Exceptional $56,709 |
| Immigrants | Ireland | 100.0 /100 | #9 | Exceptional $56,584 |
| Okinawans | 100.0 /100 | #10 | Exceptional $55,817 |
| Eastern Europeans | 100.0 /100 | #11 | Exceptional $55,780 |
| Immigrants | Sweden | 100.0 /100 | #12 | Exceptional $55,582 |
| Immigrants | India | 100.0 /100 | #13 | Exceptional $55,268 |
| Immigrants | Belgium | 100.0 /100 | #14 | Exceptional $55,082 |
| Cypriots | 100.0 /100 | #15 | Exceptional $54,899 |
| Immigrants | Switzerland | 100.0 /100 | #16 | Exceptional $54,866 |
Demographics Similar to Pakistanis by Per Capita Income
In terms of per capita income, the demographic groups most similar to Pakistanis are Slovene ($45,581, a difference of 0.010%), Jordanian ($45,605, a difference of 0.040%), Immigrants from North Macedonia ($45,622, a difference of 0.080%), Arab ($45,662, a difference of 0.16%), and Luxembourger ($45,663, a difference of 0.17%).
| Demographics | Rating | Rank | Per Capita Income |
| Palestinians | 91.6 /100 | #126 | Exceptional $45,790 |
| Immigrants | Germany | 91.3 /100 | #127 | Exceptional $45,751 |
| Swedes | 91.3 /100 | #128 | Exceptional $45,750 |
| Luxembourgers | 90.4 /100 | #129 | Exceptional $45,663 |
| Arabs | 90.4 /100 | #130 | Exceptional $45,662 |
| Immigrants | North Macedonia | 90.0 /100 | #131 | Exceptional $45,622 |
| Jordanians | 89.9 /100 | #132 | Excellent $45,605 |
| Pakistanis | 89.7 /100 | #133 | Excellent $45,587 |
| Slovenes | 89.6 /100 | #134 | Excellent $45,581 |
| Hungarians | 87.9 /100 | #135 | Excellent $45,426 |
| Immigrants | Oceania | 85.2 /100 | #136 | Excellent $45,220 |
| Immigrants | Syria | 85.2 /100 | #137 | Excellent $45,218 |
| Assyrians/Chaldeans/Syriacs | 84.8 /100 | #138 | Excellent $45,195 |
| Basques | 83.2 /100 | #139 | Excellent $45,086 |
| Immigrants | Jordan | 82.9 /100 | #140 | Excellent $45,066 |