Immigrants from Ireland vs Immigrants from Hong Kong Householder Income Under 25 years
COMPARE
Immigrants from Ireland
Immigrants from Hong Kong
Householder Income Under 25 years
Householder Income Under 25 years Comparison
Immigrants from Ireland
Immigrants from Hong Kong
$57,075
HOUSEHOLDER INCOME UNDER 25 YEARS
100.0/ 100
METRIC RATING
20th/ 347
METRIC RANK
$62,083
HOUSEHOLDER INCOME UNDER 25 YEARS
100.0/ 100
METRIC RATING
2nd/ 347
METRIC RANK
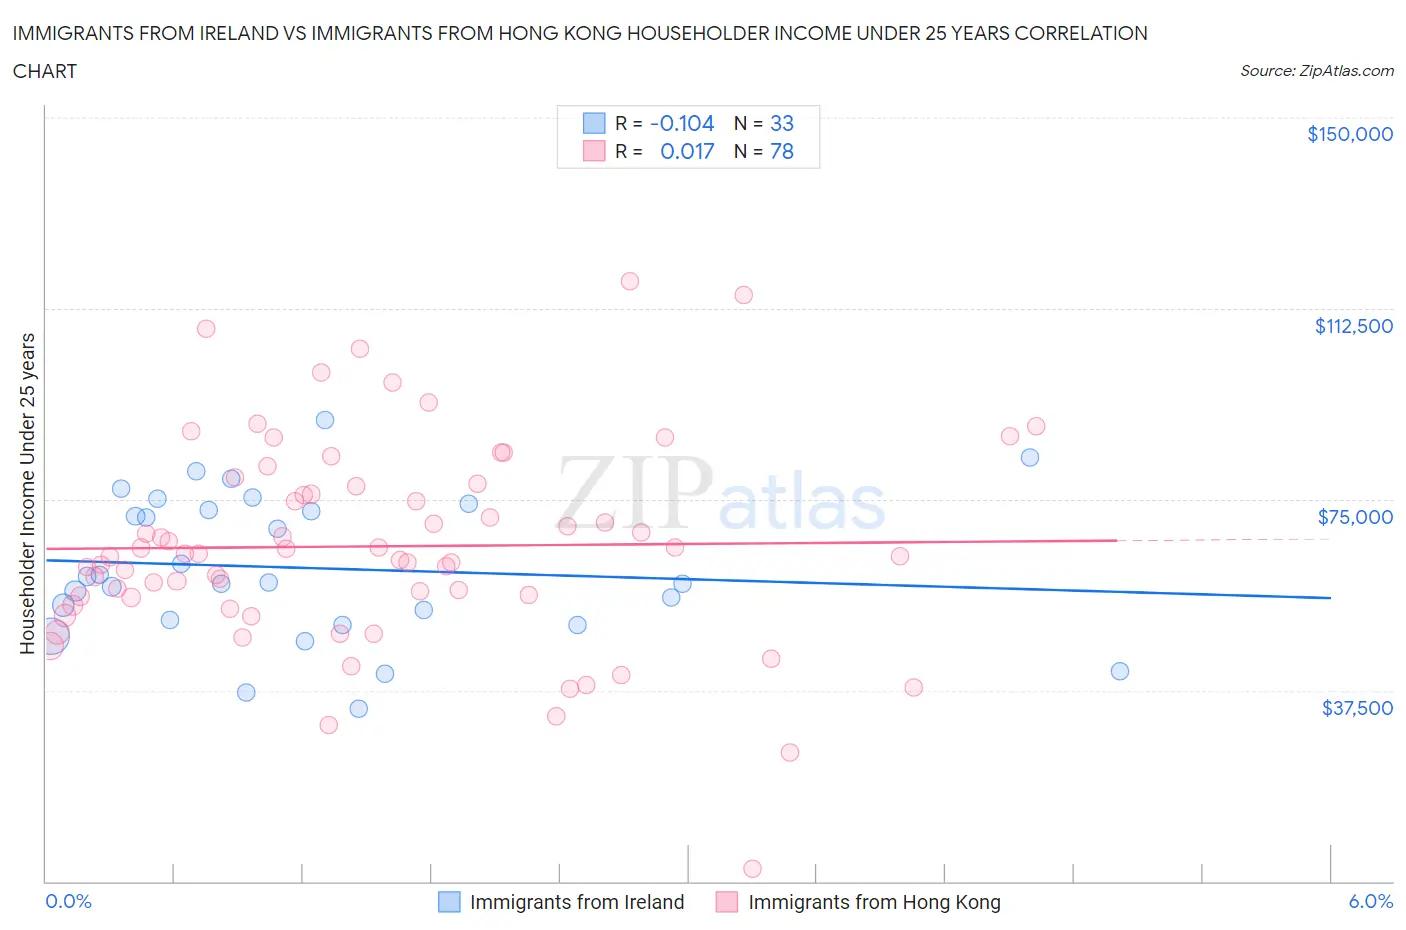
Immigrants from Ireland vs Immigrants from Hong Kong Householder Income Under 25 years Correlation Chart
The statistical analysis conducted on geographies consisting of 203,844,468 people shows a poor negative correlation between the proportion of Immigrants from Ireland and household income with householder under the age of 25 in the United States with a correlation coefficient (R) of -0.104 and weighted average of $57,075. Similarly, the statistical analysis conducted on geographies consisting of 218,049,197 people shows no correlation between the proportion of Immigrants from Hong Kong and household income with householder under the age of 25 in the United States with a correlation coefficient (R) of 0.017 and weighted average of $62,083, a difference of 8.8%.
Householder Income Under 25 years Correlation Summary
| Measurement | Immigrants from Ireland | Immigrants from Hong Kong |
| Minimum | $33,875 | $2,499 |
| Maximum | $90,500 | $117,772 |
| Range | $56,625 | $115,273 |
| Mean | $61,493 | $65,784 |
| Median | $58,663 | $64,057 |
| Interquartile 25% (IQ1) | $50,831 | $55,752 |
| Interquartile 75% (IQ3) | $73,599 | $77,500 |
| Interquartile Range (IQR) | $22,768 | $21,748 |
| Standard Deviation (Sample) | $14,181 | $20,300 |
| Standard Deviation (Population) | $13,964 | $20,169 |
Demographics Similar to Immigrants from Ireland and Immigrants from Hong Kong by Householder Income Under 25 years
In terms of householder income under 25 years, the demographic groups most similar to Immigrants from Ireland are Immigrants from Fiji ($57,074, a difference of 0.0%), Bhutanese ($57,078, a difference of 0.010%), Immigrants from Eastern Asia ($57,123, a difference of 0.080%), Sierra Leonean ($57,272, a difference of 0.35%), and Immigrants from Afghanistan ($57,478, a difference of 0.71%). Similarly, the demographic groups most similar to Immigrants from Hong Kong are Immigrants from India ($59,914, a difference of 3.6%), Immigrants from Taiwan ($59,424, a difference of 4.5%), Immigrants from Bolivia ($59,389, a difference of 4.5%), Thai ($59,187, a difference of 4.9%), and Assyrian/Chaldean/Syriac ($65,329, a difference of 5.2%).
| Demographics | Rating | Rank | Householder Income Under 25 years |
| Assyrians/Chaldeans/Syriacs | 100.0 /100 | #1 | Exceptional $65,329 |
| Immigrants | Hong Kong | 100.0 /100 | #2 | Exceptional $62,083 |
| Immigrants | India | 100.0 /100 | #3 | Exceptional $59,914 |
| Immigrants | Taiwan | 100.0 /100 | #4 | Exceptional $59,424 |
| Immigrants | Bolivia | 100.0 /100 | #5 | Exceptional $59,389 |
| Thais | 100.0 /100 | #6 | Exceptional $59,187 |
| Bolivians | 100.0 /100 | #7 | Exceptional $58,506 |
| Indians (Asian) | 100.0 /100 | #8 | Exceptional $58,239 |
| Chinese | 100.0 /100 | #9 | Exceptional $58,162 |
| Afghans | 100.0 /100 | #10 | Exceptional $58,019 |
| Immigrants | China | 100.0 /100 | #11 | Exceptional $57,931 |
| Immigrants | Philippines | 100.0 /100 | #12 | Exceptional $57,930 |
| Immigrants | South Central Asia | 100.0 /100 | #13 | Exceptional $57,818 |
| Filipinos | 100.0 /100 | #14 | Exceptional $57,740 |
| Koreans | 100.0 /100 | #15 | Exceptional $57,730 |
| Immigrants | Afghanistan | 100.0 /100 | #16 | Exceptional $57,478 |
| Sierra Leoneans | 100.0 /100 | #17 | Exceptional $57,272 |
| Immigrants | Eastern Asia | 100.0 /100 | #18 | Exceptional $57,123 |
| Bhutanese | 100.0 /100 | #19 | Exceptional $57,078 |
| Immigrants | Ireland | 100.0 /100 | #20 | Exceptional $57,075 |
| Immigrants | Fiji | 100.0 /100 | #21 | Exceptional $57,074 |