Immigrants from Iraq vs Puget Sound Salish Householder Income Under 25 years
COMPARE
Immigrants from Iraq
Puget Sound Salish
Householder Income Under 25 years
Householder Income Under 25 years Comparison
Immigrants from Iraq
Puget Sound Salish
$53,384
HOUSEHOLDER INCOME UNDER 25 YEARS
94.9/ 100
METRIC RATING
123rd/ 347
METRIC RANK
$55,543
HOUSEHOLDER INCOME UNDER 25 YEARS
100.0/ 100
METRIC RATING
50th/ 347
METRIC RANK
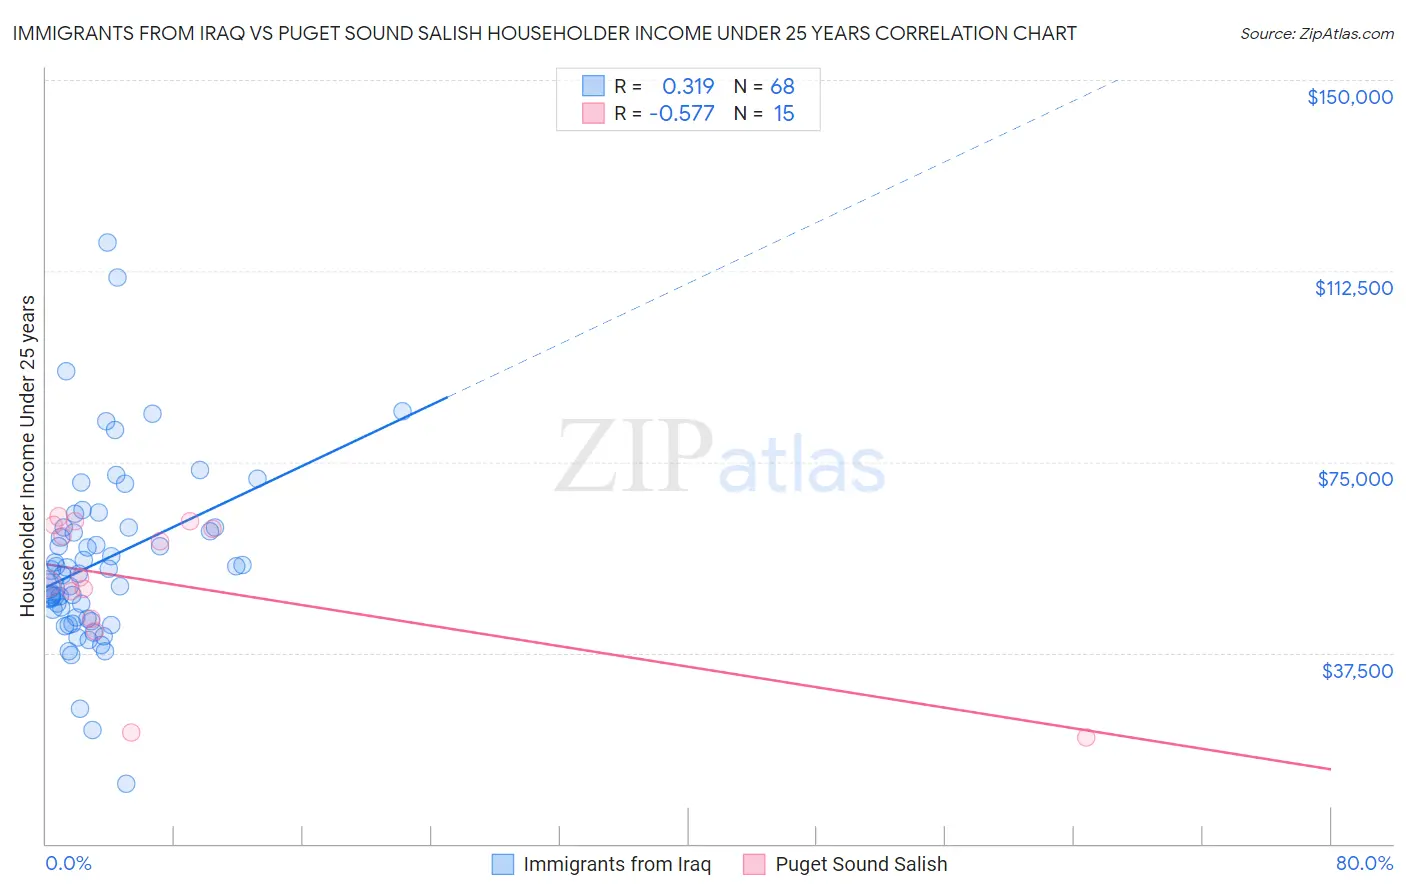
Immigrants from Iraq vs Puget Sound Salish Householder Income Under 25 years Correlation Chart
The statistical analysis conducted on geographies consisting of 177,702,127 people shows a mild positive correlation between the proportion of Immigrants from Iraq and household income with householder under the age of 25 in the United States with a correlation coefficient (R) of 0.319 and weighted average of $53,384. Similarly, the statistical analysis conducted on geographies consisting of 43,619,014 people shows a substantial negative correlation between the proportion of Puget Sound Salish and household income with householder under the age of 25 in the United States with a correlation coefficient (R) of -0.577 and weighted average of $55,543, a difference of 4.0%.
Householder Income Under 25 years Correlation Summary
| Measurement | Immigrants from Iraq | Puget Sound Salish |
| Minimum | $11,835 | $20,833 |
| Maximum | $117,992 | $64,208 |
| Range | $106,157 | $43,375 |
| Mean | $55,491 | $51,133 |
| Median | $53,349 | $52,249 |
| Interquartile 25% (IQ1) | $44,386 | $44,250 |
| Interquartile 75% (IQ3) | $62,069 | $62,601 |
| Interquartile Range (IQR) | $17,683 | $18,351 |
| Standard Deviation (Sample) | $17,748 | $14,105 |
| Standard Deviation (Population) | $17,617 | $13,627 |
Similar Demographics by Householder Income Under 25 years
Demographics Similar to Immigrants from Iraq by Householder Income Under 25 years
In terms of householder income under 25 years, the demographic groups most similar to Immigrants from Iraq are Immigrants from Ethiopia ($53,408, a difference of 0.040%), Immigrants from Canada ($53,411, a difference of 0.050%), Colombian ($53,357, a difference of 0.050%), Guamanian/Chamorro ($53,423, a difference of 0.070%), and Italian ($53,426, a difference of 0.080%).
| Demographics | Rating | Rank | Householder Income Under 25 years |
| Immigrants | Spain | 96.6 /100 | #116 | Exceptional $53,560 |
| Lithuanians | 96.6 /100 | #117 | Exceptional $53,552 |
| Immigrants | Switzerland | 96.3 /100 | #118 | Exceptional $53,528 |
| Italians | 95.4 /100 | #119 | Exceptional $53,426 |
| Guamanians/Chamorros | 95.3 /100 | #120 | Exceptional $53,423 |
| Immigrants | Canada | 95.2 /100 | #121 | Exceptional $53,411 |
| Immigrants | Ethiopia | 95.2 /100 | #122 | Exceptional $53,408 |
| Immigrants | Iraq | 94.9 /100 | #123 | Exceptional $53,384 |
| Colombians | 94.6 /100 | #124 | Exceptional $53,357 |
| Pakistanis | 94.1 /100 | #125 | Exceptional $53,325 |
| Immigrants | Serbia | 94.1 /100 | #126 | Exceptional $53,321 |
| Immigrants | North America | 93.9 /100 | #127 | Exceptional $53,307 |
| Immigrants | Bulgaria | 93.9 /100 | #128 | Exceptional $53,305 |
| New Zealanders | 93.7 /100 | #129 | Exceptional $53,294 |
| Nicaraguans | 93.4 /100 | #130 | Exceptional $53,275 |
Demographics Similar to Puget Sound Salish by Householder Income Under 25 years
In terms of householder income under 25 years, the demographic groups most similar to Puget Sound Salish are Iranian ($55,548, a difference of 0.010%), Immigrants from Vietnam ($55,562, a difference of 0.030%), Immigrants from Romania ($55,522, a difference of 0.040%), Immigrants from Indonesia ($55,521, a difference of 0.040%), and Spanish American Indian ($55,573, a difference of 0.050%).
| Demographics | Rating | Rank | Householder Income Under 25 years |
| Immigrants | South Eastern Asia | 100.0 /100 | #43 | Exceptional $55,714 |
| Paraguayans | 100.0 /100 | #44 | Exceptional $55,614 |
| Spanish American Indians | 100.0 /100 | #45 | Exceptional $55,573 |
| Immigrants | Eastern Europe | 100.0 /100 | #46 | Exceptional $55,572 |
| Cambodians | 100.0 /100 | #47 | Exceptional $55,571 |
| Immigrants | Vietnam | 100.0 /100 | #48 | Exceptional $55,562 |
| Iranians | 100.0 /100 | #49 | Exceptional $55,548 |
| Puget Sound Salish | 100.0 /100 | #50 | Exceptional $55,543 |
| Immigrants | Romania | 100.0 /100 | #51 | Exceptional $55,522 |
| Immigrants | Indonesia | 100.0 /100 | #52 | Exceptional $55,521 |
| Immigrants | Poland | 100.0 /100 | #53 | Exceptional $55,474 |
| Sri Lankans | 100.0 /100 | #54 | Exceptional $55,470 |
| Immigrants | Ukraine | 100.0 /100 | #55 | Exceptional $55,447 |
| Salvadorans | 100.0 /100 | #56 | Exceptional $55,412 |
| Soviet Union | 100.0 /100 | #57 | Exceptional $55,340 |