Immigrants from Iran vs Houma Per Capita Income
COMPARE
Immigrants from Iran
Houma
Per Capita Income
Per Capita Income Comparison
Immigrants from Iran
Houma
$57,759
PER CAPITA INCOME
100.0/ 100
METRIC RATING
5th/ 347
METRIC RANK
$32,996
PER CAPITA INCOME
0.0/ 100
METRIC RATING
337th/ 347
METRIC RANK
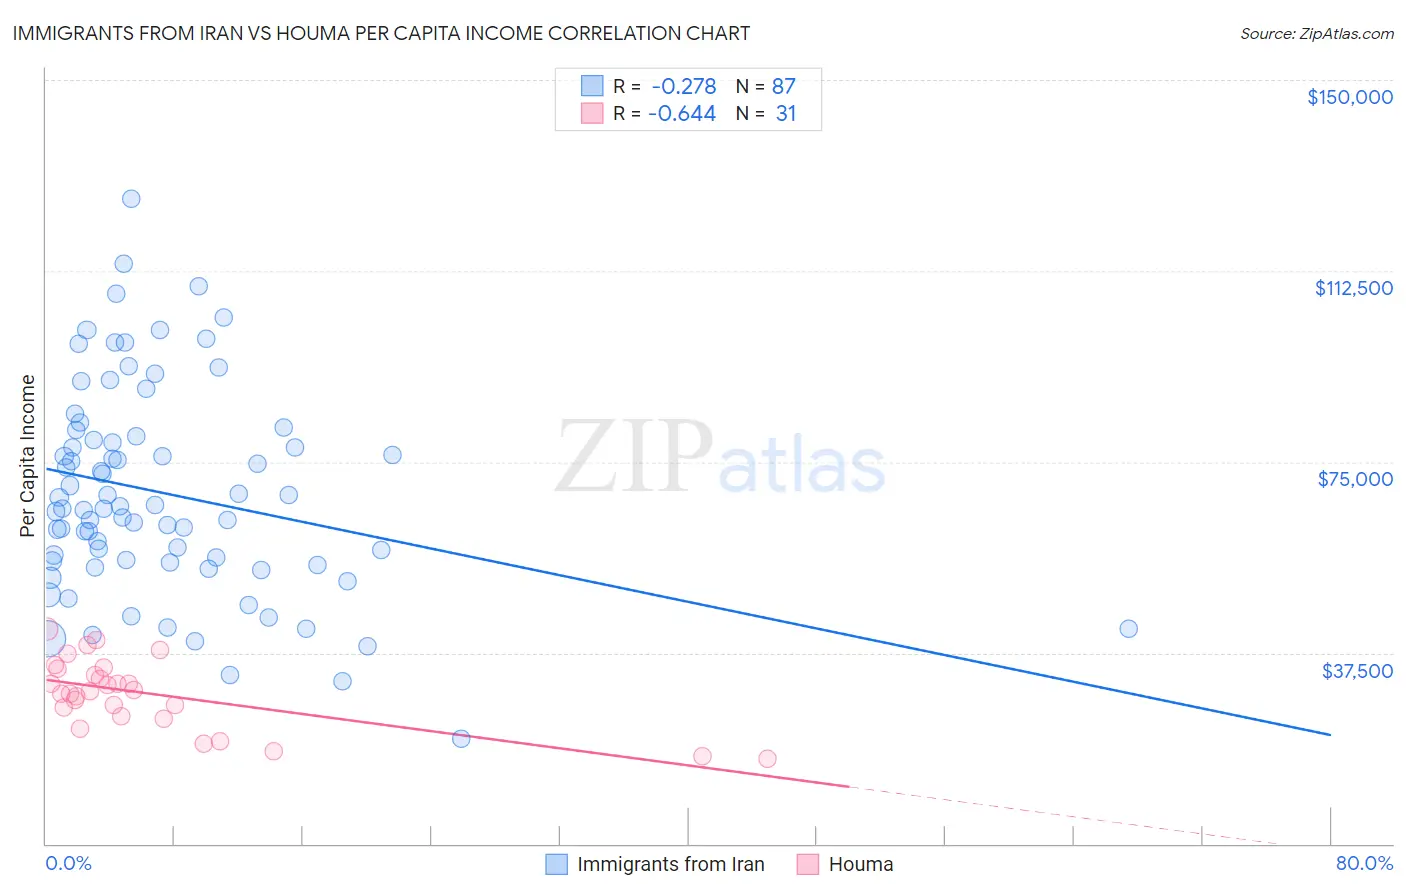
Immigrants from Iran vs Houma Per Capita Income Correlation Chart
The statistical analysis conducted on geographies consisting of 279,905,207 people shows a weak negative correlation between the proportion of Immigrants from Iran and per capita income in the United States with a correlation coefficient (R) of -0.278 and weighted average of $57,759. Similarly, the statistical analysis conducted on geographies consisting of 36,799,095 people shows a significant negative correlation between the proportion of Houma and per capita income in the United States with a correlation coefficient (R) of -0.644 and weighted average of $32,996, a difference of 75.0%.
Per Capita Income Correlation Summary
| Measurement | Immigrants from Iran | Houma |
| Minimum | $20,655 | $16,626 |
| Maximum | $126,563 | $42,187 |
| Range | $105,908 | $25,561 |
| Mean | $68,785 | $29,455 |
| Median | $65,816 | $29,877 |
| Interquartile 25% (IQ1) | $55,345 | $25,090 |
| Interquartile 75% (IQ3) | $79,969 | $34,460 |
| Interquartile Range (IQR) | $24,624 | $9,370 |
| Standard Deviation (Sample) | $20,524 | $6,714 |
| Standard Deviation (Population) | $20,406 | $6,604 |
Similar Demographics by Per Capita Income
Demographics Similar to Immigrants from Iran by Per Capita Income
In terms of per capita income, the demographic groups most similar to Immigrants from Iran are Immigrants from Taiwan ($57,742, a difference of 0.030%), Immigrants from Australia ($57,953, a difference of 0.34%), Immigrants from Israel ($57,384, a difference of 0.65%), Immigrants from Singapore ($58,353, a difference of 1.0%), and Iranian ($58,786, a difference of 1.8%).
| Demographics | Rating | Rank | Per Capita Income |
| Filipinos | 100.0 /100 | #1 | Exceptional $59,066 |
| Iranians | 100.0 /100 | #2 | Exceptional $58,786 |
| Immigrants | Singapore | 100.0 /100 | #3 | Exceptional $58,353 |
| Immigrants | Australia | 100.0 /100 | #4 | Exceptional $57,953 |
| Immigrants | Iran | 100.0 /100 | #5 | Exceptional $57,759 |
| Immigrants | Taiwan | 100.0 /100 | #6 | Exceptional $57,742 |
| Immigrants | Israel | 100.0 /100 | #7 | Exceptional $57,384 |
| Immigrants | Hong Kong | 100.0 /100 | #8 | Exceptional $56,709 |
| Immigrants | Ireland | 100.0 /100 | #9 | Exceptional $56,584 |
| Okinawans | 100.0 /100 | #10 | Exceptional $55,817 |
| Eastern Europeans | 100.0 /100 | #11 | Exceptional $55,780 |
| Immigrants | Sweden | 100.0 /100 | #12 | Exceptional $55,582 |
| Immigrants | India | 100.0 /100 | #13 | Exceptional $55,268 |
| Immigrants | Belgium | 100.0 /100 | #14 | Exceptional $55,082 |
| Cypriots | 100.0 /100 | #15 | Exceptional $54,899 |
Demographics Similar to Houma by Per Capita Income
In terms of per capita income, the demographic groups most similar to Houma are Yakama ($33,009, a difference of 0.040%), Yuman ($33,236, a difference of 0.73%), Native/Alaskan ($33,279, a difference of 0.86%), Arapaho ($32,345, a difference of 2.0%), and Immigrants from Yemen ($33,696, a difference of 2.1%).
| Demographics | Rating | Rank | Per Capita Income |
| Spanish American Indians | 0.0 /100 | #330 | Tragic $34,195 |
| Immigrants | Mexico | 0.0 /100 | #331 | Tragic $33,931 |
| Sioux | 0.0 /100 | #332 | Tragic $33,921 |
| Immigrants | Yemen | 0.0 /100 | #333 | Tragic $33,696 |
| Natives/Alaskans | 0.0 /100 | #334 | Tragic $33,279 |
| Yuman | 0.0 /100 | #335 | Tragic $33,236 |
| Yakama | 0.0 /100 | #336 | Tragic $33,009 |
| Houma | 0.0 /100 | #337 | Tragic $32,996 |
| Arapaho | 0.0 /100 | #338 | Tragic $32,345 |
| Pueblo | 0.0 /100 | #339 | Tragic $32,012 |
| Crow | 0.0 /100 | #340 | Tragic $31,729 |
| Puerto Ricans | 0.0 /100 | #341 | Tragic $31,268 |
| Hopi | 0.0 /100 | #342 | Tragic $31,177 |
| Pima | 0.0 /100 | #343 | Tragic $30,644 |
| Yup'ik | 0.0 /100 | #344 | Tragic $30,518 |