Immigrants from Iran vs Asian Householder Income Over 65 years
COMPARE
Immigrants from Iran
Asian
Householder Income Over 65 years
Householder Income Over 65 years Comparison
Immigrants from Iran
Asians
$75,081
HOUSEHOLDER INCOME OVER 65 YEARS
100.0/ 100
METRIC RATING
5th/ 347
METRIC RANK
$68,822
HOUSEHOLDER INCOME OVER 65 YEARS
100.0/ 100
METRIC RATING
32nd/ 347
METRIC RANK
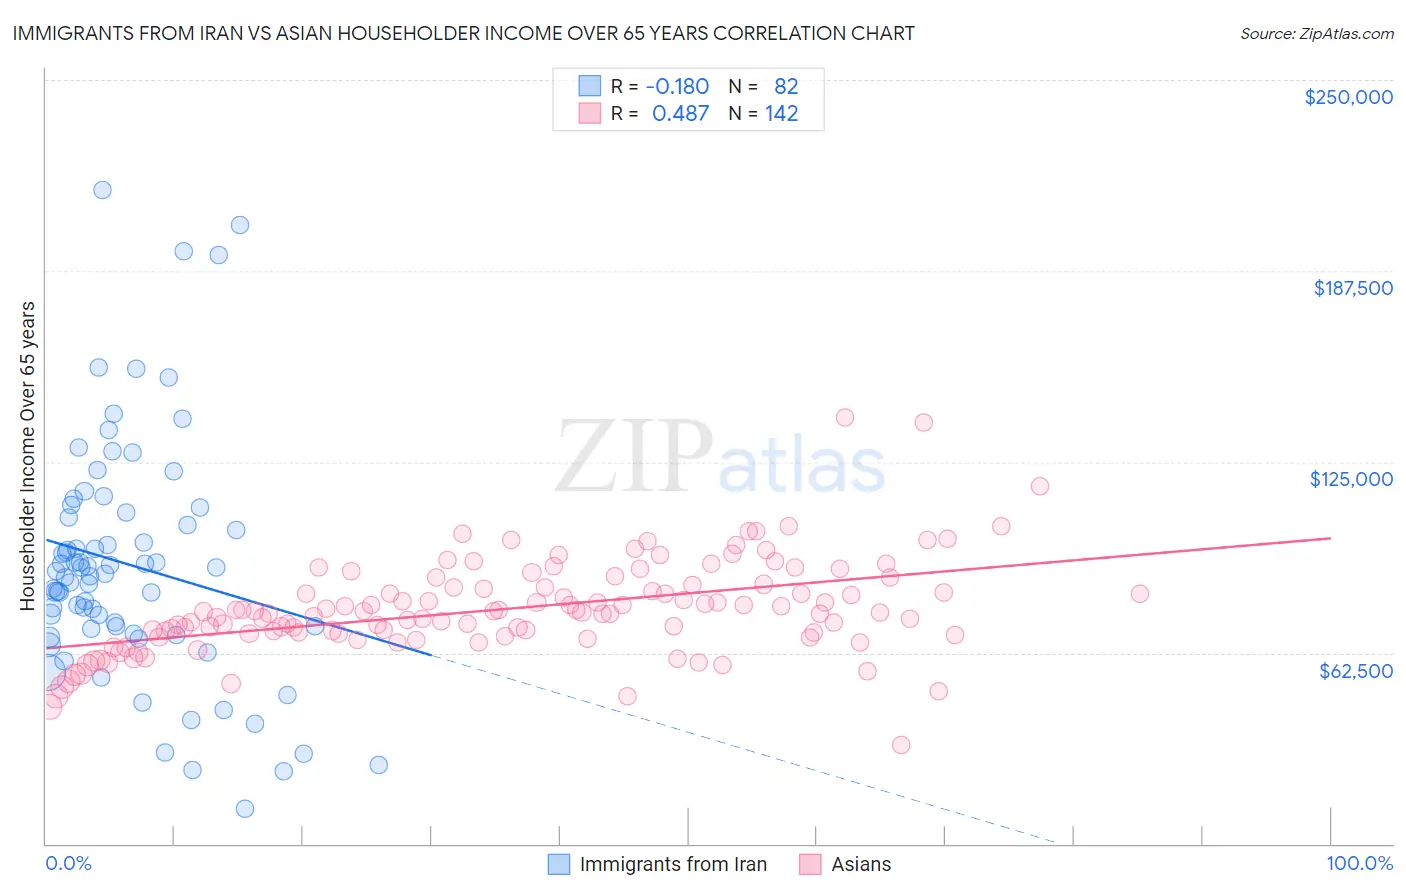
Immigrants from Iran vs Asian Householder Income Over 65 years Correlation Chart
The statistical analysis conducted on geographies consisting of 279,536,688 people shows a poor negative correlation between the proportion of Immigrants from Iran and household income with householder over the age of 65 in the United States with a correlation coefficient (R) of -0.180 and weighted average of $75,081. Similarly, the statistical analysis conducted on geographies consisting of 546,636,612 people shows a moderate positive correlation between the proportion of Asians and household income with householder over the age of 65 in the United States with a correlation coefficient (R) of 0.487 and weighted average of $68,822, a difference of 9.1%.
Householder Income Over 65 years Correlation Summary
| Measurement | Immigrants from Iran | Asian |
| Minimum | $11,563 | $32,121 |
| Maximum | $214,063 | $139,689 |
| Range | $202,500 | $107,568 |
| Mean | $91,354 | $76,866 |
| Median | $88,665 | $75,680 |
| Interquartile 25% (IQ1) | $70,285 | $68,749 |
| Interquartile 75% (IQ3) | $108,269 | $84,063 |
| Interquartile Range (IQR) | $37,985 | $15,314 |
| Standard Deviation (Sample) | $39,442 | $15,572 |
| Standard Deviation (Population) | $39,201 | $15,517 |
Similar Demographics by Householder Income Over 65 years
Demographics Similar to Immigrants from Iran by Householder Income Over 65 years
In terms of householder income over 65 years, the demographic groups most similar to Immigrants from Iran are Bolivian ($74,245, a difference of 1.1%), Filipino ($76,686, a difference of 2.1%), Immigrants from Bolivia ($73,434, a difference of 2.2%), Immigrants from Taiwan ($77,051, a difference of 2.6%), and Immigrants from Singapore ($72,963, a difference of 2.9%).
| Demographics | Rating | Rank | Householder Income Over 65 years |
| Chinese | 100.0 /100 | #1 | Exceptional $77,465 |
| Iranians | 100.0 /100 | #2 | Exceptional $77,429 |
| Immigrants | Taiwan | 100.0 /100 | #3 | Exceptional $77,051 |
| Filipinos | 100.0 /100 | #4 | Exceptional $76,686 |
| Immigrants | Iran | 100.0 /100 | #5 | Exceptional $75,081 |
| Bolivians | 100.0 /100 | #6 | Exceptional $74,245 |
| Immigrants | Bolivia | 100.0 /100 | #7 | Exceptional $73,434 |
| Immigrants | Singapore | 100.0 /100 | #8 | Exceptional $72,963 |
| Immigrants | India | 100.0 /100 | #9 | Exceptional $72,804 |
| Bhutanese | 100.0 /100 | #10 | Exceptional $72,288 |
| Thais | 100.0 /100 | #11 | Exceptional $72,099 |
| Cypriots | 100.0 /100 | #12 | Exceptional $71,714 |
| Immigrants | Hong Kong | 100.0 /100 | #13 | Exceptional $71,567 |
| Burmese | 100.0 /100 | #14 | Exceptional $71,139 |
| Native Hawaiians | 100.0 /100 | #15 | Exceptional $71,021 |
Demographics Similar to Asians by Householder Income Over 65 years
In terms of householder income over 65 years, the demographic groups most similar to Asians are Immigrants from Denmark ($68,801, a difference of 0.030%), Afghan ($68,951, a difference of 0.19%), Immigrants from Northern Europe ($69,003, a difference of 0.26%), Immigrants from Ireland ($68,495, a difference of 0.48%), and Immigrants from Australia ($69,164, a difference of 0.50%).
| Demographics | Rating | Rank | Householder Income Over 65 years |
| Immigrants | Belgium | 100.0 /100 | #25 | Exceptional $69,703 |
| Immigrants | Sri Lanka | 100.0 /100 | #26 | Exceptional $69,426 |
| Immigrants | Switzerland | 100.0 /100 | #27 | Exceptional $69,343 |
| Immigrants | China | 100.0 /100 | #28 | Exceptional $69,174 |
| Immigrants | Australia | 100.0 /100 | #29 | Exceptional $69,164 |
| Immigrants | Northern Europe | 100.0 /100 | #30 | Exceptional $69,003 |
| Afghans | 100.0 /100 | #31 | Exceptional $68,951 |
| Asians | 100.0 /100 | #32 | Exceptional $68,822 |
| Immigrants | Denmark | 100.0 /100 | #33 | Exceptional $68,801 |
| Immigrants | Ireland | 100.0 /100 | #34 | Exceptional $68,495 |
| Tongans | 100.0 /100 | #35 | Exceptional $68,235 |
| Immigrants | Austria | 99.9 /100 | #36 | Exceptional $68,208 |
| Turks | 99.9 /100 | #37 | Exceptional $68,037 |
| Estonians | 99.9 /100 | #38 | Exceptional $67,926 |
| Russians | 99.9 /100 | #39 | Exceptional $67,626 |