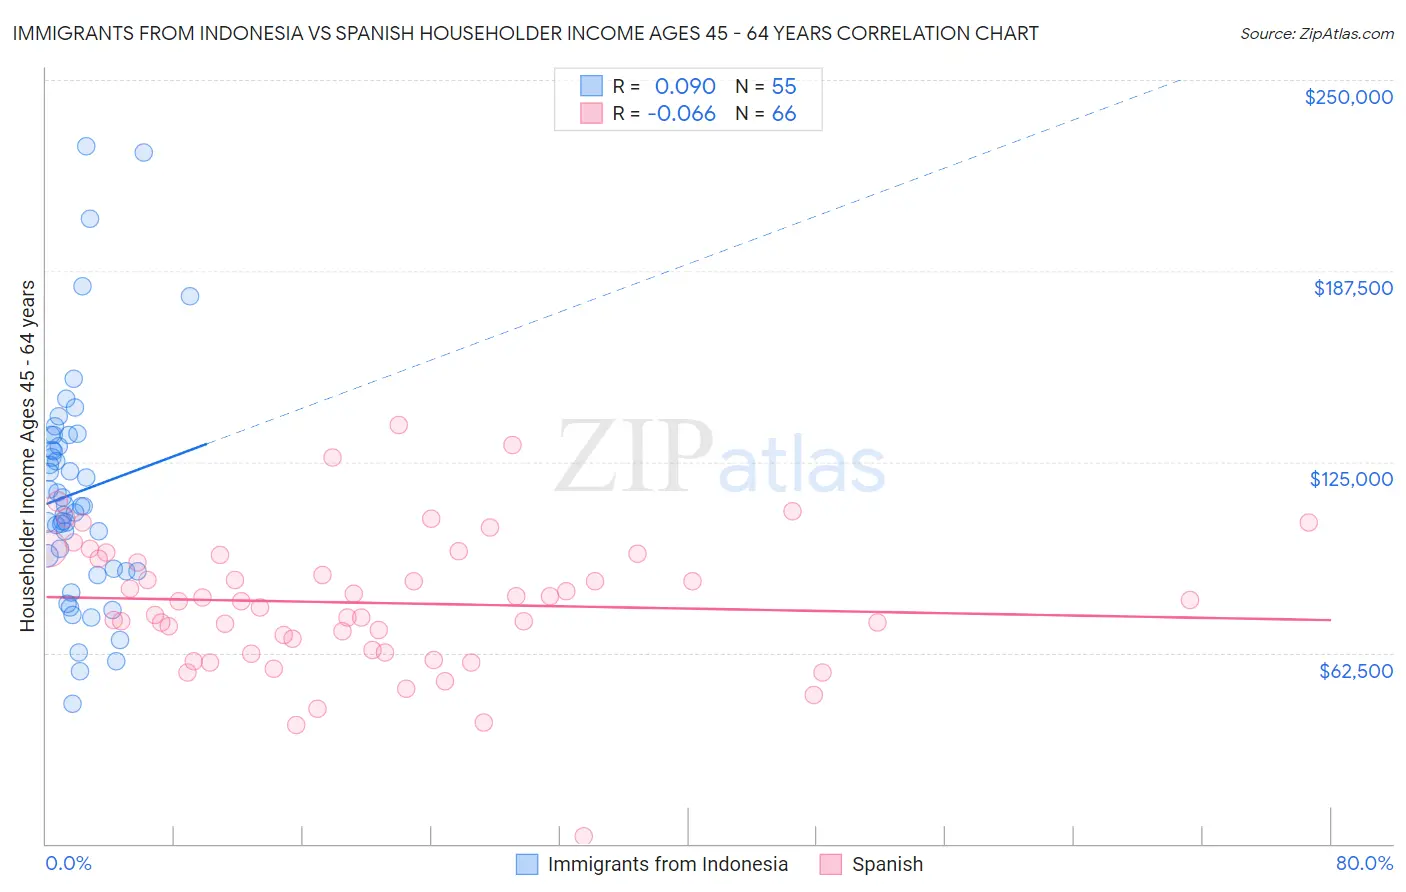
Immigrants from Indonesia vs Spanish Householder Income Ages 45 - 64 years
COMPARE
Immigrants from Indonesia
Spanish
Householder Income Ages 45 - 64 years
Householder Income Ages 45 - 64 years Comparison
Immigrants from Indonesia
Spanish
$113,519
HOUSEHOLDER INCOME AGES 45 - 64 YEARS
99.9/ 100
METRIC RATING
48th/ 347
METRIC RANK
$98,554
HOUSEHOLDER INCOME AGES 45 - 64 YEARS
29.2/ 100
METRIC RATING
195th/ 347
METRIC RANK
Immigrants from Indonesia vs Spanish Householder Income Ages 45 - 64 years Correlation Chart
The statistical analysis conducted on geographies consisting of 215,592,111 people shows a slight positive correlation between the proportion of Immigrants from Indonesia and household income with householder between the ages 45 and 64 in the United States with a correlation coefficient (R) of 0.090 and weighted average of $113,519. Similarly, the statistical analysis conducted on geographies consisting of 421,243,274 people shows a slight negative correlation between the proportion of Spanish and household income with householder between the ages 45 and 64 in the United States with a correlation coefficient (R) of -0.066 and weighted average of $98,554, a difference of 15.2%.
Householder Income Ages 45 - 64 years Correlation Summary
| Measurement | Immigrants from Indonesia | Spanish |
| Minimum | $45,964 | $2,499 |
| Maximum | $228,214 | $137,143 |
| Range | $182,250 | $134,644 |
| Mean | $114,986 | $78,857 |
| Median | $110,532 | $79,247 |
| Interquartile 25% (IQ1) | $89,063 | $63,421 |
| Interquartile 75% (IQ3) | $133,651 | $94,394 |
| Interquartile Range (IQR) | $44,588 | $30,972 |
| Standard Deviation (Sample) | $37,980 | $22,794 |
| Standard Deviation (Population) | $37,633 | $22,620 |
Similar Demographics by Householder Income Ages 45 - 64 years
Demographics Similar to Immigrants from Indonesia by Householder Income Ages 45 - 64 years
In terms of householder income ages 45 - 64 years, the demographic groups most similar to Immigrants from Indonesia are Australian ($113,533, a difference of 0.010%), Immigrants from Greece ($113,548, a difference of 0.030%), Immigrants from France ($113,680, a difference of 0.14%), Immigrants from Russia ($113,215, a difference of 0.27%), and Bulgarian ($113,883, a difference of 0.32%).
| Demographics | Rating | Rank | Householder Income Ages 45 - 64 years |
| Immigrants | Lithuania | 99.9 /100 | #41 | Exceptional $114,336 |
| Estonians | 99.9 /100 | #42 | Exceptional $114,220 |
| Israelis | 99.9 /100 | #43 | Exceptional $114,186 |
| Bulgarians | 99.9 /100 | #44 | Exceptional $113,883 |
| Immigrants | France | 99.9 /100 | #45 | Exceptional $113,680 |
| Immigrants | Greece | 99.9 /100 | #46 | Exceptional $113,548 |
| Australians | 99.9 /100 | #47 | Exceptional $113,533 |
| Immigrants | Indonesia | 99.9 /100 | #48 | Exceptional $113,519 |
| Immigrants | Russia | 99.8 /100 | #49 | Exceptional $113,215 |
| Immigrants | Austria | 99.8 /100 | #50 | Exceptional $113,140 |
| Immigrants | South Africa | 99.8 /100 | #51 | Exceptional $112,886 |
| Immigrants | Malaysia | 99.8 /100 | #52 | Exceptional $112,796 |
| Afghans | 99.8 /100 | #53 | Exceptional $112,676 |
| Greeks | 99.8 /100 | #54 | Exceptional $112,630 |
| Lithuanians | 99.8 /100 | #55 | Exceptional $112,484 |
Demographics Similar to Spanish by Householder Income Ages 45 - 64 years
In terms of householder income ages 45 - 64 years, the demographic groups most similar to Spanish are Immigrants from Eastern Africa ($98,467, a difference of 0.090%), Uruguayan ($98,660, a difference of 0.11%), Puget Sound Salish ($98,340, a difference of 0.22%), Hawaiian ($98,778, a difference of 0.23%), and Celtic ($98,896, a difference of 0.35%).
| Demographics | Rating | Rank | Householder Income Ages 45 - 64 years |
| Immigrants | Portugal | 36.3 /100 | #188 | Fair $99,203 |
| Immigrants | South America | 35.4 /100 | #189 | Fair $99,126 |
| French Canadians | 35.1 /100 | #190 | Fair $99,093 |
| Kenyans | 33.7 /100 | #191 | Fair $98,970 |
| Celtics | 32.9 /100 | #192 | Fair $98,896 |
| Hawaiians | 31.6 /100 | #193 | Fair $98,778 |
| Uruguayans | 30.3 /100 | #194 | Fair $98,660 |
| Spanish | 29.2 /100 | #195 | Fair $98,554 |
| Immigrants | Eastern Africa | 28.3 /100 | #196 | Fair $98,467 |
| Puget Sound Salish | 27.0 /100 | #197 | Fair $98,340 |
| Immigrants | Iraq | 25.7 /100 | #198 | Fair $98,201 |
| Whites/Caucasians | 24.6 /100 | #199 | Fair $98,091 |
| Immigrants | Kenya | 23.5 /100 | #200 | Fair $97,964 |
| Yugoslavians | 20.0 /100 | #201 | Fair $97,558 |
| Tlingit-Haida | 18.9 /100 | #202 | Poor $97,417 |