Immigrants from Indonesia vs Immigrants from Pakistan Wage/Income Gap
COMPARE
Immigrants from Indonesia
Immigrants from Pakistan
Wage/Income Gap
Wage/Income Gap Comparison
Immigrants from Indonesia
Immigrants from Pakistan
26.1%
WAGE/INCOME GAP
32.5/ 100
METRIC RATING
186th/ 347
METRIC RANK
27.0%
WAGE/INCOME GAP
4.9/ 100
METRIC RATING
234th/ 347
METRIC RANK
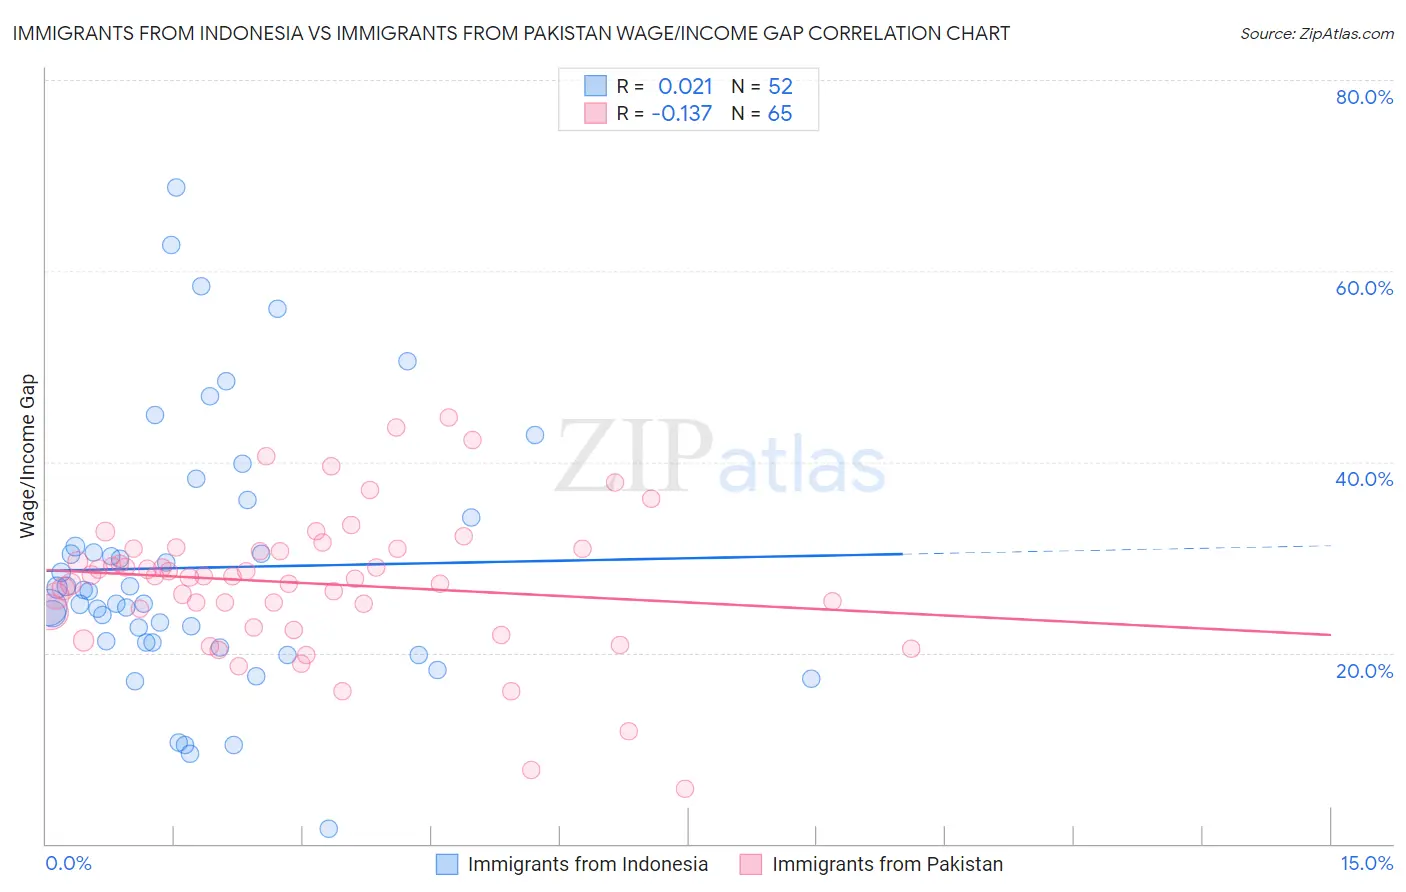
Immigrants from Indonesia vs Immigrants from Pakistan Wage/Income Gap Correlation Chart
The statistical analysis conducted on geographies consisting of 215,739,542 people shows no correlation between the proportion of Immigrants from Indonesia and wage/income gap percentage in the United States with a correlation coefficient (R) of 0.021 and weighted average of 26.1%. Similarly, the statistical analysis conducted on geographies consisting of 283,872,842 people shows a poor negative correlation between the proportion of Immigrants from Pakistan and wage/income gap percentage in the United States with a correlation coefficient (R) of -0.137 and weighted average of 27.0%, a difference of 3.6%.
Wage/Income Gap Correlation Summary
| Measurement | Immigrants from Indonesia | Immigrants from Pakistan |
| Minimum | 1.6% | 5.7% |
| Maximum | 68.7% | 44.7% |
| Range | 67.1% | 39.0% |
| Mean | 28.9% | 27.3% |
| Median | 25.8% | 28.0% |
| Interquartile 25% (IQ1) | 21.1% | 23.5% |
| Interquartile 75% (IQ3) | 32.6% | 30.9% |
| Interquartile Range (IQR) | 11.6% | 7.4% |
| Standard Deviation (Sample) | 13.7% | 7.4% |
| Standard Deviation (Population) | 13.6% | 7.4% |
Similar Demographics by Wage/Income Gap
Demographics Similar to Immigrants from Indonesia by Wage/Income Gap
In terms of wage/income gap, the demographic groups most similar to Immigrants from Indonesia are Pakistani (26.1%, a difference of 0.080%), Mexican (26.0%, a difference of 0.13%), Immigrants from Kazakhstan (26.0%, a difference of 0.19%), Palestinian (26.1%, a difference of 0.19%), and Immigrants from Serbia (26.0%, a difference of 0.20%).
| Demographics | Rating | Rank | Wage/Income Gap |
| Samoans | 38.6 /100 | #179 | Fair 26.0% |
| Guamanians/Chamorros | 38.0 /100 | #180 | Fair 26.0% |
| Immigrants | Bolivia | 36.4 /100 | #181 | Fair 26.0% |
| Immigrants | Serbia | 35.4 /100 | #182 | Fair 26.0% |
| Immigrants | Kazakhstan | 35.2 /100 | #183 | Fair 26.0% |
| Mexicans | 34.4 /100 | #184 | Fair 26.0% |
| Pakistanis | 33.7 /100 | #185 | Fair 26.1% |
| Immigrants | Indonesia | 32.5 /100 | #186 | Fair 26.1% |
| Palestinians | 29.9 /100 | #187 | Fair 26.1% |
| Immigrants | Egypt | 29.9 /100 | #188 | Fair 26.1% |
| Immigrants | Moldova | 26.6 /100 | #189 | Fair 26.2% |
| Immigrants | Croatia | 24.8 /100 | #190 | Fair 26.2% |
| Immigrants | Venezuela | 24.7 /100 | #191 | Fair 26.2% |
| Immigrants | Bulgaria | 22.5 /100 | #192 | Fair 26.3% |
| Immigrants | Jordan | 22.4 /100 | #193 | Fair 26.3% |
Demographics Similar to Immigrants from Pakistan by Wage/Income Gap
In terms of wage/income gap, the demographic groups most similar to Immigrants from Pakistan are Immigrants from Hungary (27.0%, a difference of 0.010%), Immigrants from Romania (27.0%, a difference of 0.030%), Immigrants from Brazil (27.0%, a difference of 0.050%), Argentinean (27.0%, a difference of 0.11%), and Bhutanese (27.0%, a difference of 0.13%).
| Demographics | Rating | Rank | Wage/Income Gap |
| Spaniards | 5.6 /100 | #227 | Tragic 27.0% |
| Immigrants | Turkey | 5.6 /100 | #228 | Tragic 27.0% |
| Immigrants | Asia | 5.5 /100 | #229 | Tragic 27.0% |
| Ottawa | 5.3 /100 | #230 | Tragic 27.0% |
| Bhutanese | 5.3 /100 | #231 | Tragic 27.0% |
| Argentineans | 5.2 /100 | #232 | Tragic 27.0% |
| Immigrants | Brazil | 5.0 /100 | #233 | Tragic 27.0% |
| Immigrants | Pakistan | 4.9 /100 | #234 | Tragic 27.0% |
| Immigrants | Hungary | 4.8 /100 | #235 | Tragic 27.0% |
| Immigrants | Romania | 4.8 /100 | #236 | Tragic 27.0% |
| Immigrants | Eastern Asia | 4.4 /100 | #237 | Tragic 27.1% |
| Osage | 4.4 /100 | #238 | Tragic 27.1% |
| Estonians | 4.3 /100 | #239 | Tragic 27.1% |
| Immigrants | Europe | 3.8 /100 | #240 | Tragic 27.1% |
| Creek | 3.8 /100 | #241 | Tragic 27.1% |