Immigrants from Indonesia vs Immigrants from Ireland Median Earnings

COMPARE

Immigrants from Indonesia
Race
Ancestry
AfghanAfricanAlaska NativeAlaskan AthabascanAlbanianAleutAlsatianAmericanApacheArabArapahoArgentineanArmenianAssyrian/Chaldean/SyriacAustralianAustrianBahamianBangladeshiBarbadianBasqueBelgianBelizeanBermudanBhutaneseBlackfeetBolivianBrazilianBritishBritish West IndianBulgarianBurmeseCajunCambodianCanadianCape VerdeanCarpatho RusynCelticCentral AmericanCentral American IndianCherokeeCheyenneChickasawChileanChineseChippewaChoctawColombianColvilleComancheCosta RicanCreeCreekCroatianCrowCubanCypriotCzechCzechoslovakianDanishDelawareDominicanDutchDutch West IndianEastern EuropeanEcuadorianEgyptianEnglishEstonianEthiopianEuropeanFijianFilipinoFinnishFrenchFrench American IndianFrench CanadianGermanGerman RussianGhanaianGreekGuamanian/ChamorroGuatemalanGuyaneseHaitianHmongHonduranHopiHoumaHungarianIcelanderIndian (Asian)IndonesianInupiatIranianIraqiIrishIroquoisIsraeliItalianJamaicanJapaneseJordanianKenyanKiowaKoreanLaotianLatvianLebaneseLiberianLithuanianLumbeeLuxembourgerMacedonianMalaysianMalteseMarshalleseMenomineeMexicanMexican American IndianMongolianMoroccanNative HawaiianNavajoNepaleseNew ZealanderNicaraguanNigerianNorthern EuropeanNorwegianOkinawanOsageOttawaPaiutePakistaniPalestinianPanamanianParaguayanPennsylvania GermanPeruvianPimaPolishPortuguesePotawatomiPuebloPuerto RicanPuget Sound SalishRomanianRussianSalvadoranSamoanScandinavianScotch-IrishScottishSeminoleSenegaleseSerbianShoshoneSierra LeoneanSiouxSlavicSlovakSloveneSomaliSouth AfricanSouth AmericanSouth American IndianSoviet UnionSpaniardSpanishSpanish AmericanSpanish American IndianSri LankanSubsaharan AfricanSudaneseSwedishSwissSyrianTaiwaneseThaiTlingit-HaidaTohono O'OdhamTonganTrinidadian and TobagonianTsimshianTurkishU.S. Virgin IslanderUgandanUkrainianUruguayanUteVenezuelanVietnameseWelshWest IndianYakamaYaquiYugoslavianYumanYup'ikZimbabwean
Immigration
NonimmigrantsImmigrantsAfghanistanAfricaAlbaniaArgentinaArmeniaAsiaAustraliaAustriaBahamasBangladeshBarbadosBelarusBelgiumBelizeBoliviaBosnia and HerzegovinaBrazilBulgariaBurma/MyanmarCabo VerdeCambodiaCameroonCanadaCaribbeanCentral AmericaChileChinaColombiaCongoCosta RicaCroatiaCubaCzechoslovakiaDenmarkDominicaDominican RepublicEastern AfricaEastern AsiaEastern EuropeEcuadorEgyptEl SalvadorEnglandEritreaEthiopiaEuropeFijiFranceGermanyGhanaGreeceGrenadaGuatemalaGuyanaHaitiHondurasHong KongHungaryIndiaIndonesiaIranIraqIsraelItalyJamaicaJapanJordanKazakhstanKenyaKoreaKuwaitLaosLatin AmericaLatviaLebanonLiberiaLithuaniaMalaysiaMexicoMicronesiaMiddle AfricaMoldovaMoroccoNepalNetherlandsNicaraguaNigeriaNorth AmericaNorth MacedoniaNorthern AfricaNorthern EuropeNorwayOceaniaPakistanPanamaPeruPhilippinesPolandPortugalRomaniaRussiaSaudi ArabiaScotlandSenegalSerbiaSierra LeoneSingaporeSomaliaSouth AfricaSouth AmericaSouth Central AsiaSouth Eastern AsiaSouthern EuropeSpainSri LankaSt. Vincent and the GrenadinesSudanSwedenSwitzerlandSyriaTaiwanThailandTrinidad and TobagoTurkeyUgandaUkraineUruguayUzbekistanVenezuelaVietnamWest IndiesWestern AfricaWestern AsiaWestern EuropeYemenZaireZimbabweAzores
Immigrants from Ireland
Race
Ancestry
AfghanAfricanAlaska NativeAlaskan AthabascanAlbanianAleutAlsatianAmericanApacheArabArapahoArgentineanArmenianAssyrian/Chaldean/SyriacAustralianAustrianBahamianBangladeshiBarbadianBasqueBelgianBelizeanBermudanBhutaneseBlackfeetBolivianBrazilianBritishBritish West IndianBulgarianBurmeseCajunCambodianCanadianCape VerdeanCarpatho RusynCelticCentral AmericanCentral American IndianCherokeeCheyenneChickasawChileanChineseChippewaChoctawColombianColvilleComancheCosta RicanCreeCreekCroatianCrowCubanCypriotCzechCzechoslovakianDanishDelawareDominicanDutchDutch West IndianEastern EuropeanEcuadorianEgyptianEnglishEstonianEthiopianEuropeanFijianFilipinoFinnishFrenchFrench American IndianFrench CanadianGermanGerman RussianGhanaianGreekGuamanian/ChamorroGuatemalanGuyaneseHaitianHmongHonduranHopiHoumaHungarianIcelanderIndian (Asian)IndonesianInupiatIranianIraqiIrishIroquoisIsraeliItalianJamaicanJapaneseJordanianKenyanKiowaKoreanLaotianLatvianLebaneseLiberianLithuanianLumbeeLuxembourgerMacedonianMalaysianMalteseMarshalleseMenomineeMexicanMexican American IndianMongolianMoroccanNative HawaiianNavajoNepaleseNew ZealanderNicaraguanNigerianNorthern EuropeanNorwegianOkinawanOsageOttawaPaiutePakistaniPalestinianPanamanianParaguayanPennsylvania GermanPeruvianPimaPolishPortuguesePotawatomiPuebloPuerto RicanPuget Sound SalishRomanianRussianSalvadoranSamoanScandinavianScotch-IrishScottishSeminoleSenegaleseSerbianShoshoneSierra LeoneanSiouxSlavicSlovakSloveneSomaliSouth AfricanSouth AmericanSouth American IndianSoviet UnionSpaniardSpanishSpanish AmericanSpanish American IndianSri LankanSubsaharan AfricanSudaneseSwedishSwissSyrianTaiwaneseThaiTlingit-HaidaTohono O'OdhamTonganTrinidadian and TobagonianTsimshianTurkishU.S. Virgin IslanderUgandanUkrainianUruguayanUteVenezuelanVietnameseWelshWest IndianYakamaYaquiYugoslavianYumanYup'ikZimbabwean
Immigration
NonimmigrantsImmigrantsAfghanistanAfricaAlbaniaArgentinaArmeniaAsiaAustraliaAustriaBahamasBangladeshBarbadosBelarusBelgiumBelizeBoliviaBosnia and HerzegovinaBrazilBulgariaBurma/MyanmarCabo VerdeCambodiaCameroonCanadaCaribbeanCentral AmericaChileChinaColombiaCongoCosta RicaCroatiaCubaCzechoslovakiaDenmarkDominicaDominican RepublicEastern AfricaEastern AsiaEastern EuropeEcuadorEgyptEl SalvadorEnglandEritreaEthiopiaEuropeFijiFranceGermanyGhanaGreeceGrenadaGuatemalaGuyanaHaitiHondurasHong KongHungaryIndiaIranIraqIrelandIsraelItalyJamaicaJapanJordanKazakhstanKenyaKoreaKuwaitLaosLatin AmericaLatviaLebanonLiberiaLithuaniaMalaysiaMexicoMicronesiaMiddle AfricaMoldovaMoroccoNepalNetherlandsNicaraguaNigeriaNorth AmericaNorth MacedoniaNorthern AfricaNorthern EuropeNorwayOceaniaPakistanPanamaPeruPhilippinesPolandPortugalRomaniaRussiaSaudi ArabiaScotlandSenegalSerbiaSierra LeoneSingaporeSomaliaSouth AfricaSouth AmericaSouth Central AsiaSouth Eastern AsiaSouthern EuropeSpainSri LankaSt. Vincent and the GrenadinesSudanSwedenSwitzerlandSyriaTaiwanThailandTrinidad and TobagoTurkeyUgandaUkraineUruguayUzbekistanVenezuelaVietnamWest IndiesWestern AfricaWestern AsiaWestern EuropeYemenZaireZimbabweAzores
Median Earnings
Income
Poverty
Unemployment
Labor Participation
Family Structure
Vehicle Availability
Education Level
Disability

Median Earnings Comparison

Immigrants from Indonesia

Immigrants from Ireland

Exceptional
Exceptional
$51,715
MEDIAN EARNINGS
99.9/ 100
METRIC RATING
54th/ 347
METRIC RANK
$56,854
MEDIAN EARNINGS
100.0/ 100
METRIC RATING
12th/ 347
METRIC RANK

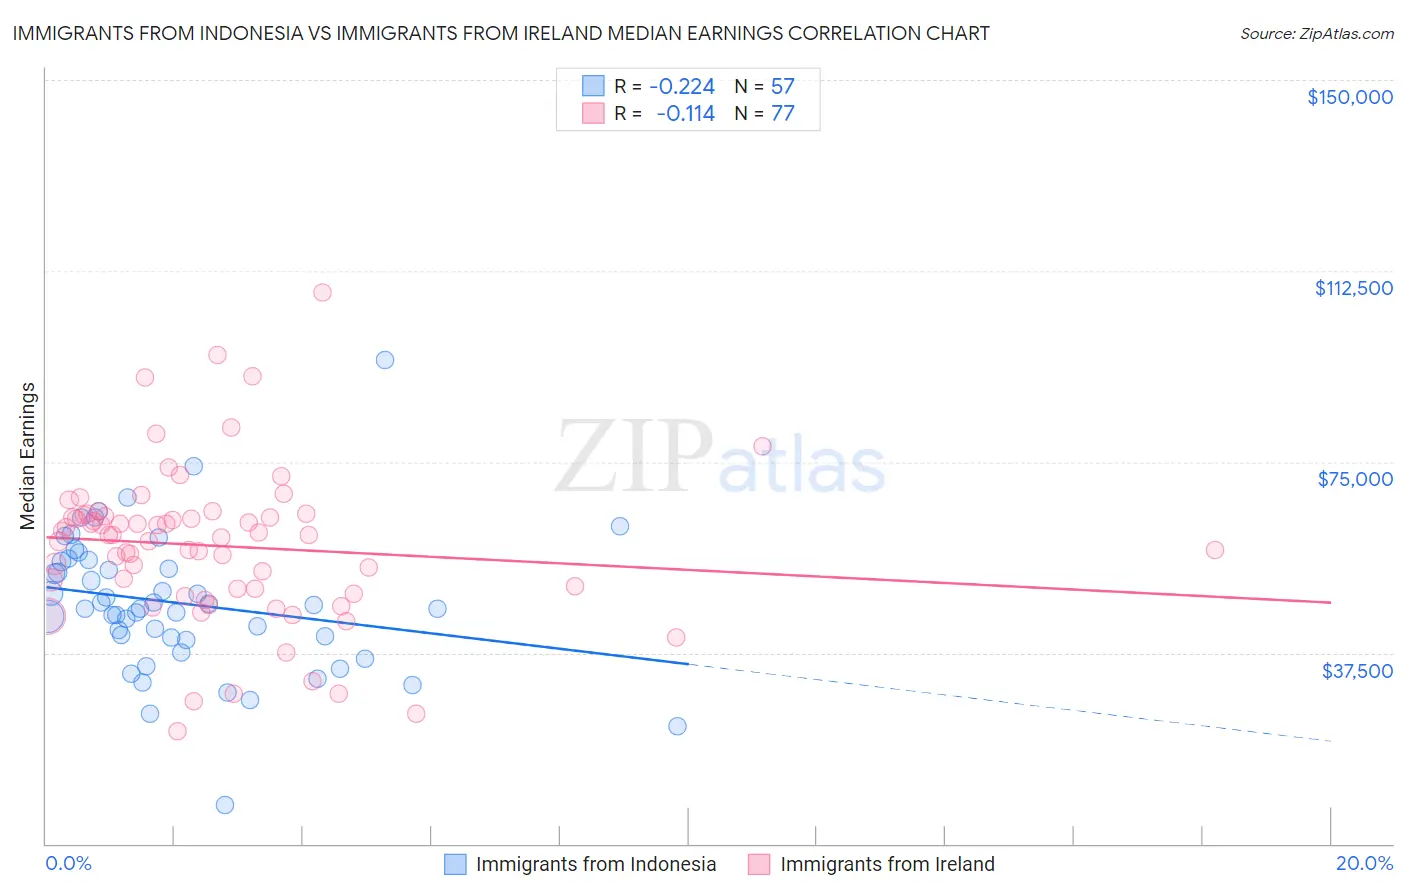
Immigrants from Indonesia vs Immigrants from Ireland Median Earnings Correlation Chart

The statistical analysis conducted on geographies consisting of 215,769,238 people shows a weak negative correlation between the proportion of Immigrants from Indonesia and median earnings in the United States with a correlation coefficient (R) of -0.224 and weighted average of $51,715. Similarly, the statistical analysis conducted on geographies consisting of 240,768,964 people shows a poor negative correlation between the proportion of Immigrants from Ireland and median earnings in the United States with a correlation coefficient (R) of -0.114 and weighted average of $56,854, a difference of 9.9%.
Immigrants from Indonesia vs Immigrants from Ireland Median Earnings

Median Earnings Correlation Summary

MeasurementImmigrants from IndonesiaImmigrants from Ireland
Minimum$7,703$22,198
Maximum$95,117$108,333
Range$87,414$86,135
Mean$47,201$58,485
Median$46,101$60,577
Interquartile 25% (IQ1)$40,269$49,600
Interquartile 75% (IQ3)$55,574$64,376
Interquartile Range (IQR)$15,305$14,776
Standard Deviation (Sample)$13,842$15,214
Standard Deviation (Population)$13,720$15,114

Similar Demographics by Median Earnings

Demographics Similar to Immigrants from Indonesia by Median Earnings

In terms of median earnings, the demographic groups most similar to Immigrants from Indonesia are Egyptian ($51,701, a difference of 0.030%), Immigrants from Pakistan ($51,693, a difference of 0.040%), Immigrants from Norway ($51,758, a difference of 0.080%), Estonian ($51,772, a difference of 0.11%), and Immigrants from Eastern Europe ($51,624, a difference of 0.18%).
DemographicsRating | RankMedian Earnings
Australians
100.0
/100
|
#47
Exceptional
$52,294
Immigrants | Europe
100.0
/100
|
#48
Exceptional
$52,195
Bolivians
100.0
/100
|
#49
Exceptional
$52,005
Immigrants | South Africa
100.0
/100
|
#50
Exceptional
$51,850
Immigrants | Austria
99.9
/100
|
#51
Exceptional
$51,826
Estonians
99.9
/100
|
#52
Exceptional
$51,772
Immigrants | Norway
99.9
/100
|
#53
Exceptional
$51,758
Immigrants | Indonesia
99.9
/100
|
#54
Exceptional
$51,715
Egyptians
99.9
/100
|
#55
Exceptional
$51,701
Immigrants | Pakistan
99.9
/100
|
#56
Exceptional
$51,693
Immigrants | Eastern Europe
99.9
/100
|
#57
Exceptional
$51,624
Immigrants | Bolivia
99.9
/100
|
#58
Exceptional
$51,605
Immigrants | Croatia
99.9
/100
|
#59
Exceptional
$51,581
Immigrants | Serbia
99.9
/100
|
#60
Exceptional
$51,557
Immigrants | Latvia
99.9
/100
|
#61
Exceptional
$51,555

Demographics Similar to Immigrants from Ireland by Median Earnings

In terms of median earnings, the demographic groups most similar to Immigrants from Ireland are Immigrants from Israel ($57,034, a difference of 0.32%), Immigrants from China ($56,638, a difference of 0.38%), Immigrants from South Central Asia ($57,114, a difference of 0.46%), Immigrants from Australia ($56,305, a difference of 0.97%), and Indian (Asian) ($56,253, a difference of 1.1%).
DemographicsRating | RankMedian Earnings
Thais
100.0
/100
|
#5
Exceptional
$59,237
Immigrants | Singapore
100.0
/100
|
#6
Exceptional
$59,038
Iranians
100.0
/100
|
#7
Exceptional
$58,474
Immigrants | Iran
100.0
/100
|
#8
Exceptional
$57,612
Okinawans
100.0
/100
|
#9
Exceptional
$57,550
Immigrants | South Central Asia
100.0
/100
|
#10
Exceptional
$57,114
Immigrants | Israel
100.0
/100
|
#11
Exceptional
$57,034
Immigrants | Ireland
100.0
/100
|
#12
Exceptional
$56,854
Immigrants | China
100.0
/100
|
#13
Exceptional
$56,638
Immigrants | Australia
100.0
/100
|
#14
Exceptional
$56,305
Indians (Asian)
100.0
/100
|
#15
Exceptional
$56,253
Immigrants | Eastern Asia
100.0
/100
|
#16
Exceptional
$56,183
Eastern Europeans
100.0
/100
|
#17
Exceptional
$55,084
Immigrants | Japan
100.0
/100
|
#18
Exceptional
$54,938
Immigrants | Belgium
100.0
/100
|
#19
Exceptional
$54,679