Immigrants from India vs Houma Median Female Earnings
COMPARE
Immigrants from India
Houma
Median Female Earnings
Median Female Earnings Comparison
Immigrants from India
Houma
$48,292
MEDIAN FEMALE EARNINGS
100.0/ 100
METRIC RATING
4th/ 347
METRIC RANK
$30,343
MEDIAN FEMALE EARNINGS
0.0/ 100
METRIC RATING
347th/ 347
METRIC RANK
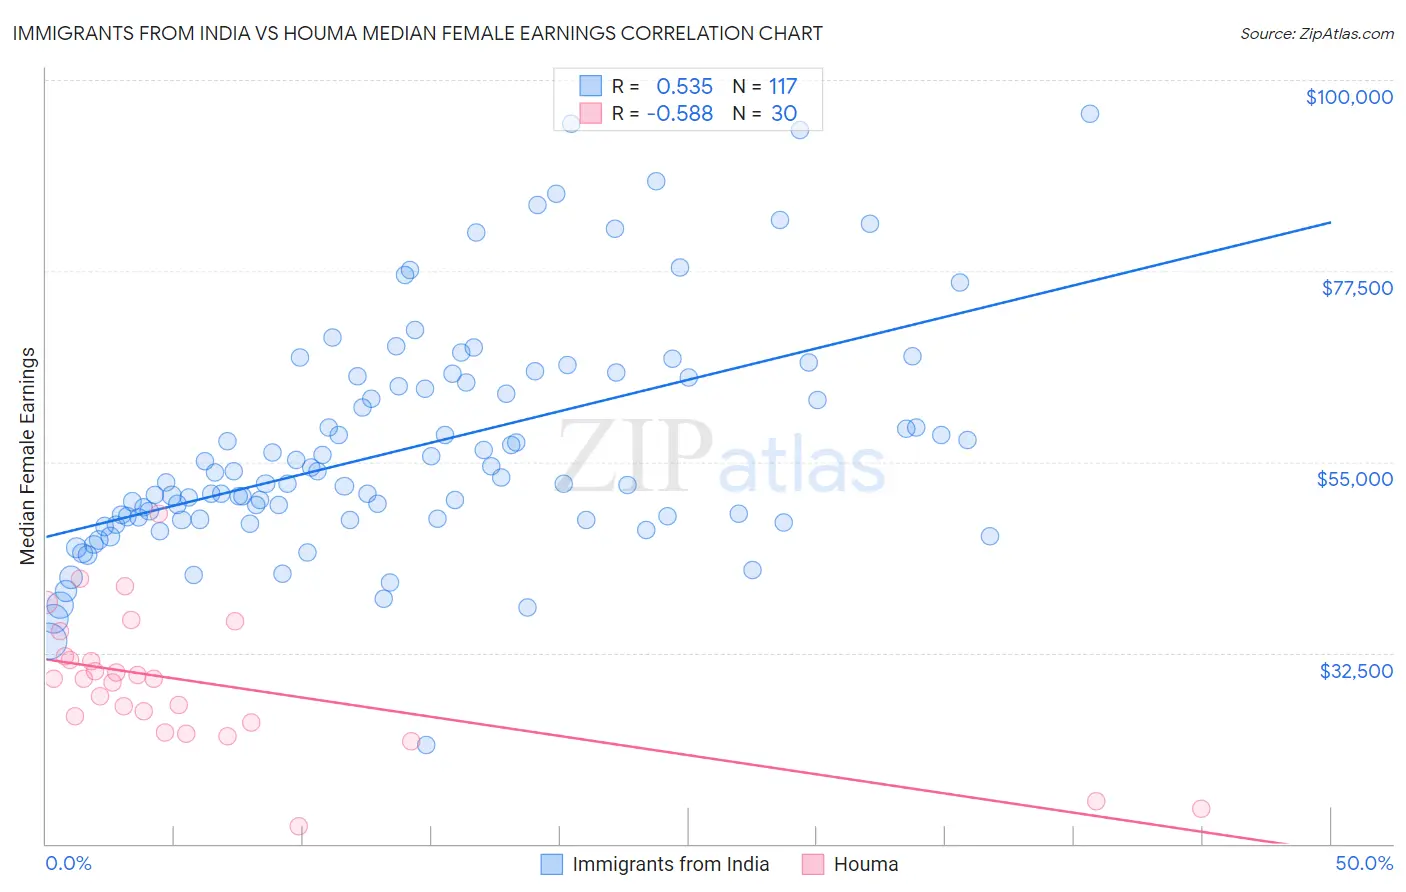
Immigrants from India vs Houma Median Female Earnings Correlation Chart
The statistical analysis conducted on geographies consisting of 433,961,093 people shows a substantial positive correlation between the proportion of Immigrants from India and median female earnings in the United States with a correlation coefficient (R) of 0.535 and weighted average of $48,292. Similarly, the statistical analysis conducted on geographies consisting of 36,795,297 people shows a substantial negative correlation between the proportion of Houma and median female earnings in the United States with a correlation coefficient (R) of -0.588 and weighted average of $30,343, a difference of 59.2%.
Median Female Earnings Correlation Summary
| Measurement | Immigrants from India | Houma |
| Minimum | $21,591 | $12,038 |
| Maximum | $96,063 | $48,900 |
| Range | $74,472 | $36,862 |
| Mean | $56,646 | $28,868 |
| Median | $52,549 | $29,403 |
| Interquartile 25% (IQ1) | $48,205 | $24,292 |
| Interquartile 75% (IQ3) | $64,667 | $32,114 |
| Interquartile Range (IQR) | $16,462 | $7,822 |
| Standard Deviation (Sample) | $13,523 | $8,016 |
| Standard Deviation (Population) | $13,465 | $7,881 |
Similar Demographics by Median Female Earnings
Demographics Similar to Immigrants from India by Median Female Earnings
In terms of median female earnings, the demographic groups most similar to Immigrants from India are Immigrants from Singapore ($47,986, a difference of 0.64%), Immigrants from Ireland ($47,598, a difference of 1.5%), Thai ($47,577, a difference of 1.5%), Iranian ($47,421, a difference of 1.8%), and Immigrants from Taiwan ($49,256, a difference of 2.0%).
| Demographics | Rating | Rank | Median Female Earnings |
| Immigrants | Hong Kong | 100.0 /100 | #1 | Exceptional $49,818 |
| Filipinos | 100.0 /100 | #2 | Exceptional $49,508 |
| Immigrants | Taiwan | 100.0 /100 | #3 | Exceptional $49,256 |
| Immigrants | India | 100.0 /100 | #4 | Exceptional $48,292 |
| Immigrants | Singapore | 100.0 /100 | #5 | Exceptional $47,986 |
| Immigrants | Ireland | 100.0 /100 | #6 | Exceptional $47,598 |
| Thais | 100.0 /100 | #7 | Exceptional $47,577 |
| Iranians | 100.0 /100 | #8 | Exceptional $47,421 |
| Immigrants | Iran | 100.0 /100 | #9 | Exceptional $47,154 |
| Immigrants | China | 100.0 /100 | #10 | Exceptional $46,972 |
| Okinawans | 100.0 /100 | #11 | Exceptional $46,905 |
| Immigrants | Israel | 100.0 /100 | #12 | Exceptional $46,902 |
| Immigrants | Australia | 100.0 /100 | #13 | Exceptional $46,573 |
| Soviet Union | 100.0 /100 | #14 | Exceptional $46,556 |
| Immigrants | Eastern Asia | 100.0 /100 | #15 | Exceptional $46,502 |
Demographics Similar to Houma by Median Female Earnings
In terms of median female earnings, the demographic groups most similar to Houma are Arapaho ($31,489, a difference of 3.8%), Puerto Rican ($31,560, a difference of 4.0%), Lumbee ($32,500, a difference of 7.1%), Pueblo ($32,564, a difference of 7.3%), and Yup'ik ($32,730, a difference of 7.9%).
| Demographics | Rating | Rank | Median Female Earnings |
| Mexicans | 0.0 /100 | #333 | Tragic $33,664 |
| Spanish American Indians | 0.0 /100 | #334 | Tragic $33,625 |
| Creek | 0.0 /100 | #335 | Tragic $33,437 |
| Ottawa | 0.0 /100 | #336 | Tragic $33,378 |
| Yakama | 0.0 /100 | #337 | Tragic $33,354 |
| Immigrants | Cuba | 0.0 /100 | #338 | Tragic $33,291 |
| Immigrants | Mexico | 0.0 /100 | #339 | Tragic $33,236 |
| Tohono O'odham | 0.0 /100 | #340 | Tragic $33,205 |
| Navajo | 0.0 /100 | #341 | Tragic $33,046 |
| Yup'ik | 0.0 /100 | #342 | Tragic $32,730 |
| Pueblo | 0.0 /100 | #343 | Tragic $32,564 |
| Lumbee | 0.0 /100 | #344 | Tragic $32,500 |
| Puerto Ricans | 0.0 /100 | #345 | Tragic $31,560 |
| Arapaho | 0.0 /100 | #346 | Tragic $31,489 |
| Houma | 0.0 /100 | #347 | Tragic $30,343 |