Immigrants from Hungary vs Danish Median Male Earnings
COMPARE
Immigrants from Hungary
Danish
Median Male Earnings
Median Male Earnings Comparison
Immigrants from Hungary
Danes
$59,806
MEDIAN MALE EARNINGS
99.5/ 100
METRIC RATING
80th/ 347
METRIC RANK
$56,246
MEDIAN MALE EARNINGS
84.8/ 100
METRIC RATING
141st/ 347
METRIC RANK
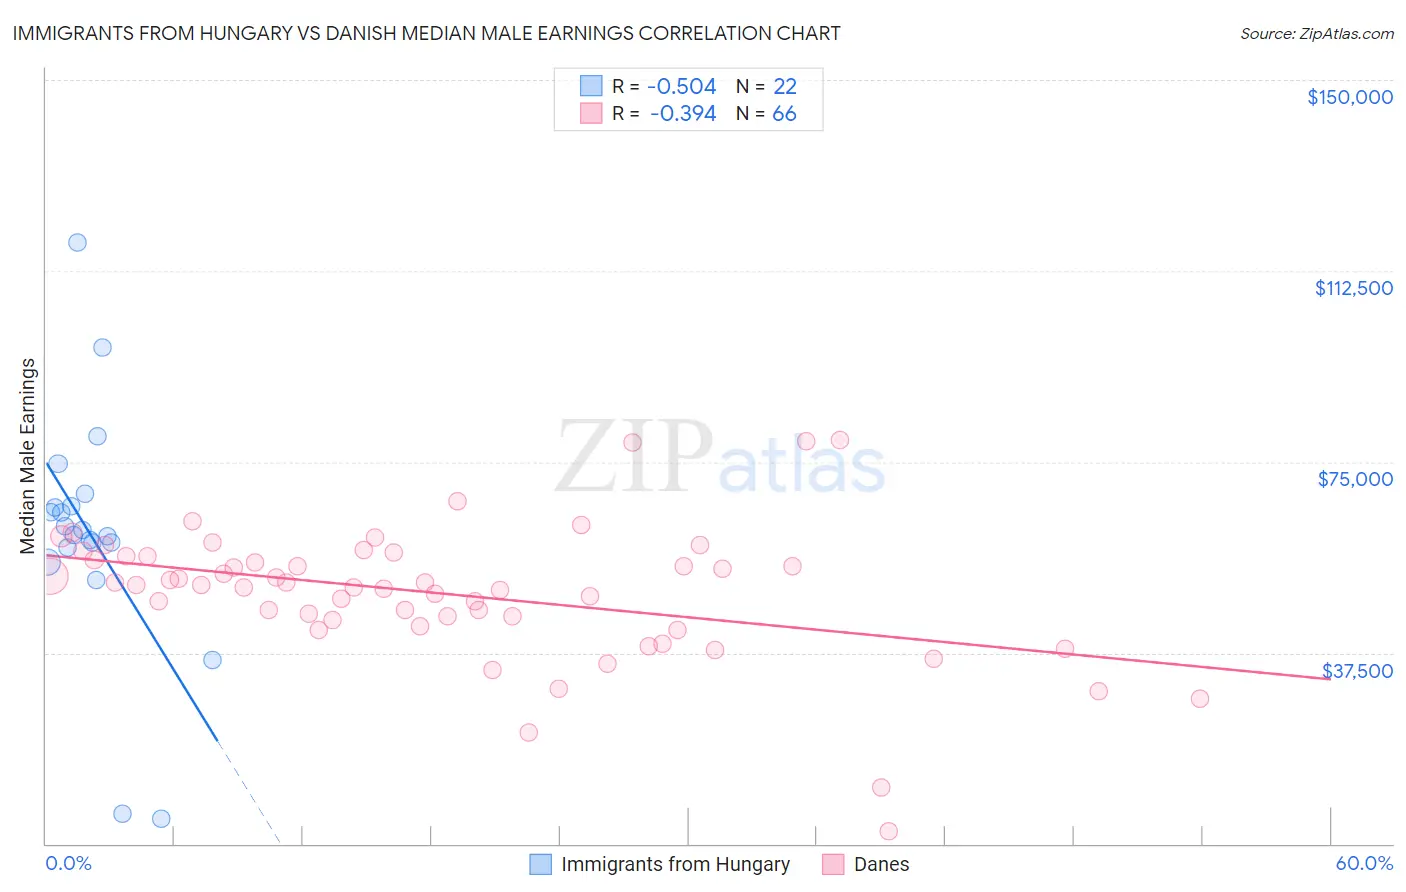
Immigrants from Hungary vs Danish Median Male Earnings Correlation Chart
The statistical analysis conducted on geographies consisting of 195,676,338 people shows a substantial negative correlation between the proportion of Immigrants from Hungary and median male earnings in the United States with a correlation coefficient (R) of -0.504 and weighted average of $59,806. Similarly, the statistical analysis conducted on geographies consisting of 473,826,770 people shows a mild negative correlation between the proportion of Danes and median male earnings in the United States with a correlation coefficient (R) of -0.394 and weighted average of $56,246, a difference of 6.3%.
Median Male Earnings Correlation Summary
| Measurement | Immigrants from Hungary | Danish |
| Minimum | $4,861 | $2,499 |
| Maximum | $118,099 | $79,323 |
| Range | $113,238 | $76,824 |
| Mean | $60,734 | $49,129 |
| Median | $61,103 | $50,861 |
| Interquartile 25% (IQ1) | $58,200 | $43,822 |
| Interquartile 75% (IQ3) | $66,315 | $56,381 |
| Interquartile Range (IQR) | $8,115 | $12,560 |
| Standard Deviation (Sample) | $24,141 | $13,278 |
| Standard Deviation (Population) | $23,586 | $13,177 |
Similar Demographics by Median Male Earnings
Demographics Similar to Immigrants from Hungary by Median Male Earnings
In terms of median male earnings, the demographic groups most similar to Immigrants from Hungary are Immigrants from Ukraine ($59,820, a difference of 0.020%), Ukrainian ($59,728, a difference of 0.13%), Croatian ($59,715, a difference of 0.15%), Immigrants from Italy ($59,691, a difference of 0.19%), and Immigrants from Egypt ($59,925, a difference of 0.20%).
| Demographics | Rating | Rank | Median Male Earnings |
| Immigrants | North America | 99.7 /100 | #73 | Exceptional $60,265 |
| Argentineans | 99.6 /100 | #74 | Exceptional $60,117 |
| Immigrants | Bolivia | 99.6 /100 | #75 | Exceptional $60,088 |
| Romanians | 99.6 /100 | #76 | Exceptional $60,063 |
| Paraguayans | 99.5 /100 | #77 | Exceptional $59,975 |
| Immigrants | Egypt | 99.5 /100 | #78 | Exceptional $59,925 |
| Immigrants | Ukraine | 99.5 /100 | #79 | Exceptional $59,820 |
| Immigrants | Hungary | 99.5 /100 | #80 | Exceptional $59,806 |
| Ukrainians | 99.4 /100 | #81 | Exceptional $59,728 |
| Croatians | 99.4 /100 | #82 | Exceptional $59,715 |
| Immigrants | Italy | 99.4 /100 | #83 | Exceptional $59,691 |
| Afghans | 99.3 /100 | #84 | Exceptional $59,554 |
| Italians | 99.3 /100 | #85 | Exceptional $59,551 |
| Immigrants | England | 99.3 /100 | #86 | Exceptional $59,527 |
| Macedonians | 99.3 /100 | #87 | Exceptional $59,522 |
Demographics Similar to Danes by Median Male Earnings
In terms of median male earnings, the demographic groups most similar to Danes are Ethiopian ($56,243, a difference of 0.0%), Zimbabwean ($56,302, a difference of 0.10%), Luxembourger ($56,300, a difference of 0.10%), Slovak ($56,306, a difference of 0.11%), and Sri Lankan ($56,136, a difference of 0.19%).
| Demographics | Rating | Rank | Median Male Earnings |
| Moroccans | 87.7 /100 | #134 | Excellent $56,499 |
| Irish | 87.4 /100 | #135 | Excellent $56,464 |
| Immigrants | Saudi Arabia | 87.2 /100 | #136 | Excellent $56,452 |
| Slavs | 86.5 /100 | #137 | Excellent $56,390 |
| Slovaks | 85.5 /100 | #138 | Excellent $56,306 |
| Zimbabweans | 85.5 /100 | #139 | Excellent $56,302 |
| Luxembourgers | 85.5 /100 | #140 | Excellent $56,300 |
| Danes | 84.8 /100 | #141 | Excellent $56,246 |
| Ethiopians | 84.8 /100 | #142 | Excellent $56,243 |
| Sri Lankans | 83.4 /100 | #143 | Excellent $56,136 |
| Immigrants | Uganda | 82.4 /100 | #144 | Excellent $56,064 |
| Norwegians | 80.9 /100 | #145 | Excellent $55,965 |
| Immigrants | Chile | 80.7 /100 | #146 | Excellent $55,954 |
| Immigrants | Philippines | 78.4 /100 | #147 | Good $55,809 |
| Scottish | 78.2 /100 | #148 | Good $55,793 |