Immigrants from Haiti vs Zimbabwean Median Household Income
COMPARE
Immigrants from Haiti
Zimbabwean
Median Household Income
Median Household Income Comparison
Immigrants from Haiti
Zimbabweans
$72,599
MEDIAN HOUSEHOLD INCOME
0.0/ 100
METRIC RATING
304th/ 347
METRIC RANK
$90,618
MEDIAN HOUSEHOLD INCOME
97.2/ 100
METRIC RATING
108th/ 347
METRIC RANK
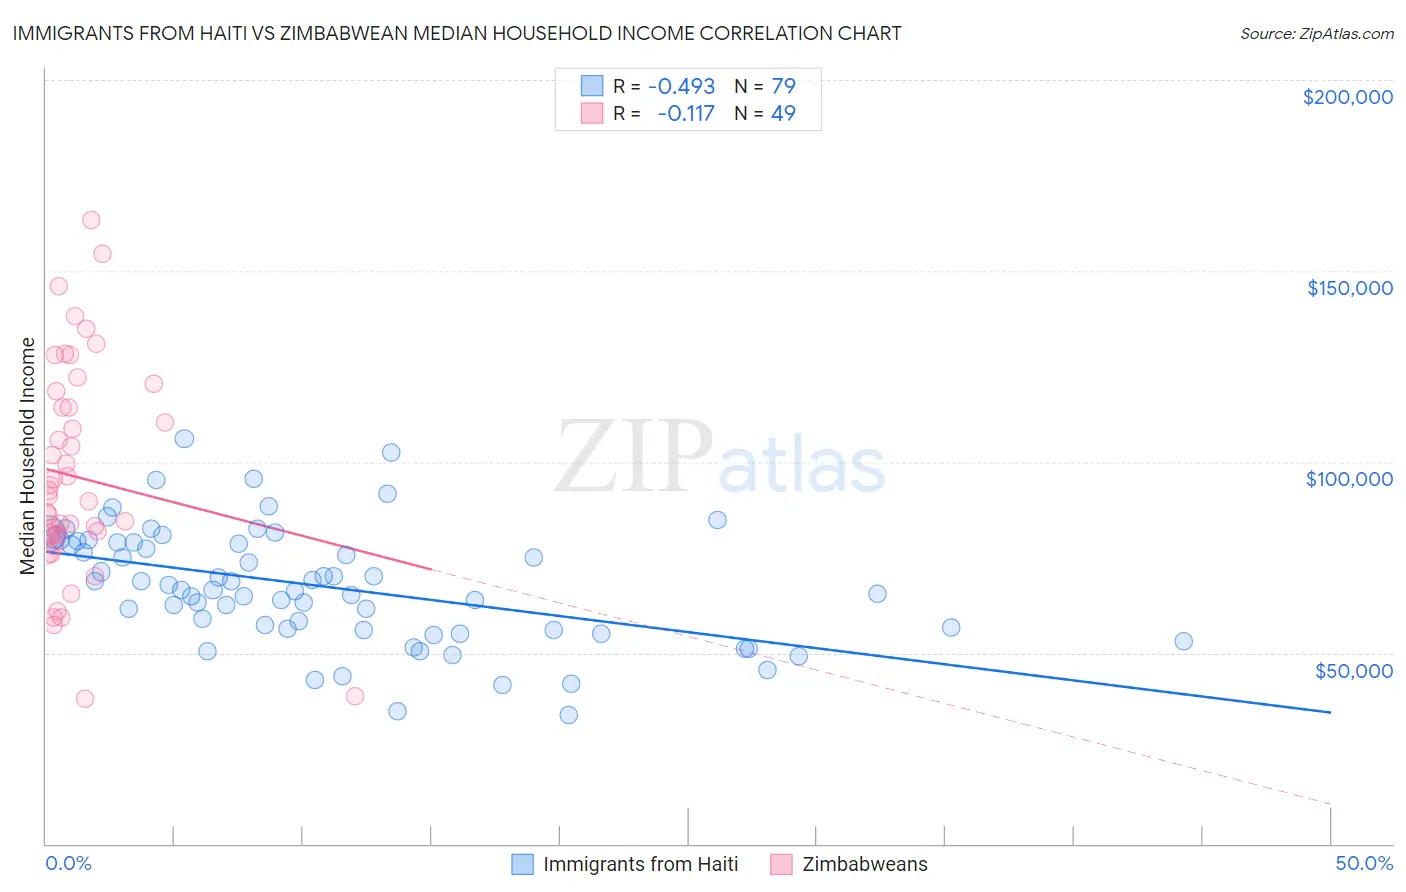
Immigrants from Haiti vs Zimbabwean Median Household Income Correlation Chart
The statistical analysis conducted on geographies consisting of 225,133,235 people shows a moderate negative correlation between the proportion of Immigrants from Haiti and median household income in the United States with a correlation coefficient (R) of -0.493 and weighted average of $72,599. Similarly, the statistical analysis conducted on geographies consisting of 69,185,411 people shows a poor negative correlation between the proportion of Zimbabweans and median household income in the United States with a correlation coefficient (R) of -0.117 and weighted average of $90,618, a difference of 24.8%.
Median Household Income Correlation Summary
| Measurement | Immigrants from Haiti | Zimbabwean |
| Minimum | $33,629 | $38,056 |
| Maximum | $105,986 | $163,274 |
| Range | $72,357 | $125,218 |
| Mean | $67,399 | $96,050 |
| Median | $66,369 | $90,998 |
| Interquartile 25% (IQ1) | $56,044 | $80,817 |
| Interquartile 75% (IQ3) | $78,973 | $116,275 |
| Interquartile Range (IQR) | $22,929 | $35,458 |
| Standard Deviation (Sample) | $15,193 | $28,116 |
| Standard Deviation (Population) | $15,096 | $27,827 |
Similar Demographics by Median Household Income
Demographics Similar to Immigrants from Haiti by Median Household Income
In terms of median household income, the demographic groups most similar to Immigrants from Haiti are Honduran ($72,588, a difference of 0.020%), Potawatomi ($72,576, a difference of 0.030%), African ($72,650, a difference of 0.070%), Shoshone ($72,660, a difference of 0.080%), and Cherokee ($72,682, a difference of 0.11%).
| Demographics | Rating | Rank | Median Household Income |
| Immigrants | Mexico | 0.0 /100 | #297 | Tragic $73,160 |
| Paiute | 0.0 /100 | #298 | Tragic $72,959 |
| Indonesians | 0.0 /100 | #299 | Tragic $72,856 |
| Immigrants | Dominica | 0.0 /100 | #300 | Tragic $72,760 |
| Cherokee | 0.0 /100 | #301 | Tragic $72,682 |
| Shoshone | 0.0 /100 | #302 | Tragic $72,660 |
| Africans | 0.0 /100 | #303 | Tragic $72,650 |
| Immigrants | Haiti | 0.0 /100 | #304 | Tragic $72,599 |
| Hondurans | 0.0 /100 | #305 | Tragic $72,588 |
| Potawatomi | 0.0 /100 | #306 | Tragic $72,576 |
| Ute | 0.0 /100 | #307 | Tragic $72,402 |
| Yakama | 0.0 /100 | #308 | Tragic $72,225 |
| Immigrants | Caribbean | 0.0 /100 | #309 | Tragic $71,860 |
| U.S. Virgin Islanders | 0.0 /100 | #310 | Tragic $71,853 |
| Immigrants | Zaire | 0.0 /100 | #311 | Tragic $71,801 |
Demographics Similar to Zimbabweans by Median Household Income
In terms of median household income, the demographic groups most similar to Zimbabweans are Chilean ($90,605, a difference of 0.020%), Palestinian ($90,574, a difference of 0.050%), Croatian ($90,685, a difference of 0.070%), Immigrants from Poland ($90,549, a difference of 0.080%), and Macedonian ($90,761, a difference of 0.16%).
| Demographics | Rating | Rank | Median Household Income |
| Immigrants | Moldova | 98.3 /100 | #101 | Exceptional $91,446 |
| Austrians | 98.2 /100 | #102 | Exceptional $91,339 |
| Immigrants | Ukraine | 98.0 /100 | #103 | Exceptional $91,124 |
| Immigrants | Kazakhstan | 97.8 /100 | #104 | Exceptional $91,015 |
| Immigrants | Brazil | 97.7 /100 | #105 | Exceptional $90,907 |
| Macedonians | 97.4 /100 | #106 | Exceptional $90,761 |
| Croatians | 97.3 /100 | #107 | Exceptional $90,685 |
| Zimbabweans | 97.2 /100 | #108 | Exceptional $90,618 |
| Chileans | 97.2 /100 | #109 | Exceptional $90,605 |
| Palestinians | 97.1 /100 | #110 | Exceptional $90,574 |
| Immigrants | Poland | 97.1 /100 | #111 | Exceptional $90,549 |
| Northern Europeans | 96.9 /100 | #112 | Exceptional $90,446 |
| Peruvians | 96.5 /100 | #113 | Exceptional $90,261 |
| Immigrants | Northern Africa | 95.9 /100 | #114 | Exceptional $90,026 |
| Immigrants | Western Asia | 95.9 /100 | #115 | Exceptional $90,005 |