Immigrants from Haiti vs Nepalese Median Male Earnings
COMPARE
Immigrants from Haiti
Nepalese
Median Male Earnings
Median Male Earnings Comparison
Immigrants from Haiti
Nepalese
$45,266
MEDIAN MALE EARNINGS
0.0/ 100
METRIC RATING
326th/ 347
METRIC RANK
$49,458
MEDIAN MALE EARNINGS
0.7/ 100
METRIC RATING
259th/ 347
METRIC RANK
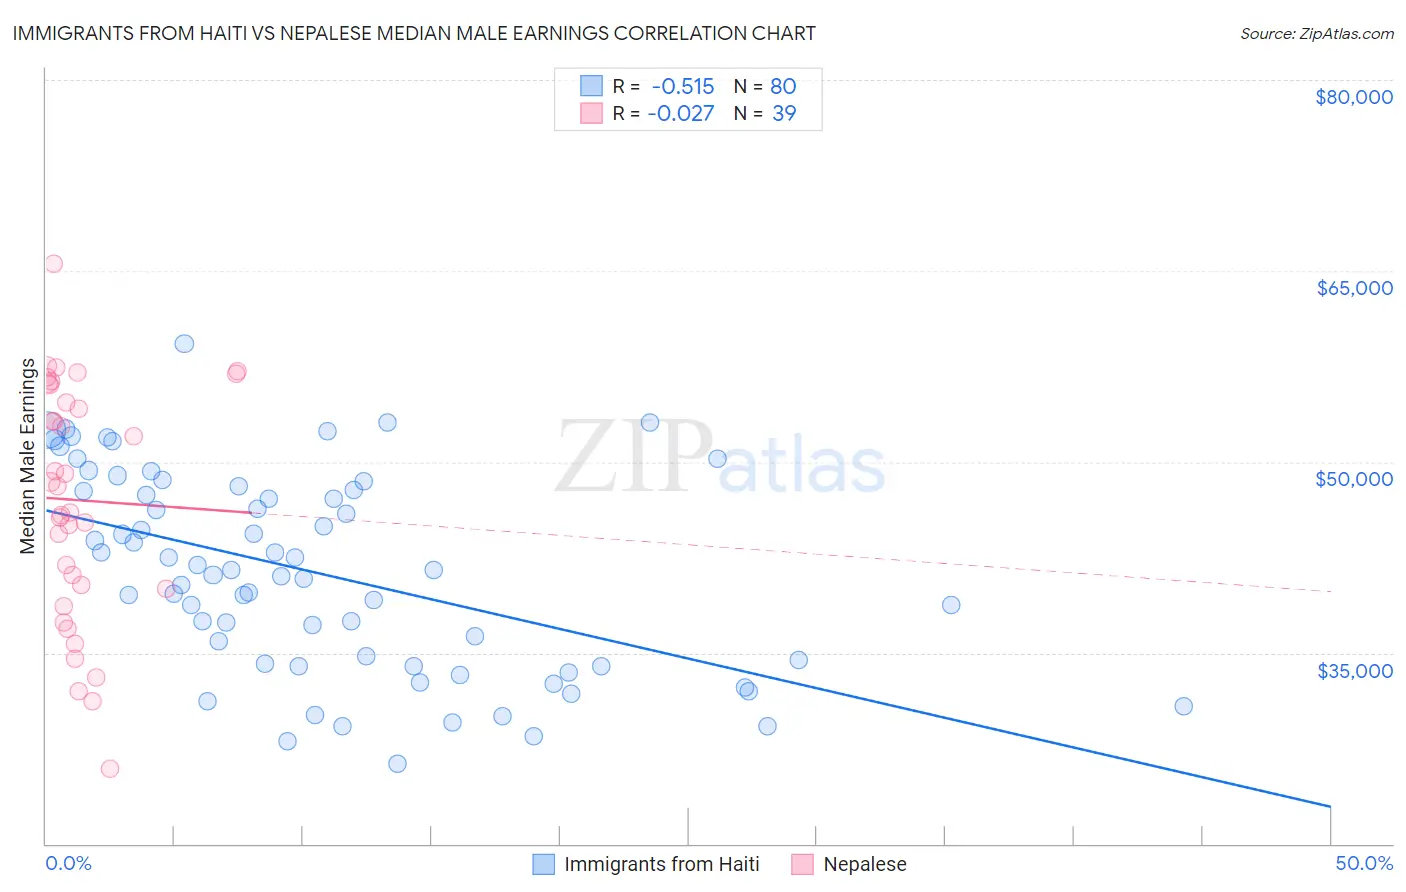
Immigrants from Haiti vs Nepalese Median Male Earnings Correlation Chart
The statistical analysis conducted on geographies consisting of 225,244,233 people shows a substantial negative correlation between the proportion of Immigrants from Haiti and median male earnings in the United States with a correlation coefficient (R) of -0.515 and weighted average of $45,266. Similarly, the statistical analysis conducted on geographies consisting of 24,431,712 people shows no correlation between the proportion of Nepalese and median male earnings in the United States with a correlation coefficient (R) of -0.027 and weighted average of $49,458, a difference of 9.3%.
Median Male Earnings Correlation Summary
| Measurement | Immigrants from Haiti | Nepalese |
| Minimum | $26,317 | $25,893 |
| Maximum | $59,316 | $65,607 |
| Range | $32,999 | $39,714 |
| Mean | $41,227 | $46,984 |
| Median | $41,309 | $48,060 |
| Interquartile 25% (IQ1) | $34,055 | $40,000 |
| Interquartile 75% (IQ3) | $47,765 | $56,086 |
| Interquartile Range (IQR) | $13,710 | $16,086 |
| Standard Deviation (Sample) | $7,780 | $9,323 |
| Standard Deviation (Population) | $7,731 | $9,202 |
Similar Demographics by Median Male Earnings
Demographics Similar to Immigrants from Haiti by Median Male Earnings
In terms of median male earnings, the demographic groups most similar to Immigrants from Haiti are Immigrants from Bahamas ($45,176, a difference of 0.20%), Kiowa ($45,094, a difference of 0.38%), Yuman ($45,446, a difference of 0.40%), Black/African American ($45,523, a difference of 0.57%), and Yakama ($45,002, a difference of 0.59%).
| Demographics | Rating | Rank | Median Male Earnings |
| Haitians | 0.0 /100 | #319 | Tragic $45,903 |
| Immigrants | Honduras | 0.0 /100 | #320 | Tragic $45,787 |
| Fijians | 0.0 /100 | #321 | Tragic $45,607 |
| Sioux | 0.0 /100 | #322 | Tragic $45,566 |
| Immigrants | Central America | 0.0 /100 | #323 | Tragic $45,538 |
| Blacks/African Americans | 0.0 /100 | #324 | Tragic $45,523 |
| Yuman | 0.0 /100 | #325 | Tragic $45,446 |
| Immigrants | Haiti | 0.0 /100 | #326 | Tragic $45,266 |
| Immigrants | Bahamas | 0.0 /100 | #327 | Tragic $45,176 |
| Kiowa | 0.0 /100 | #328 | Tragic $45,094 |
| Yakama | 0.0 /100 | #329 | Tragic $45,002 |
| Immigrants | Mexico | 0.0 /100 | #330 | Tragic $44,960 |
| Natives/Alaskans | 0.0 /100 | #331 | Tragic $44,775 |
| Bahamians | 0.0 /100 | #332 | Tragic $44,756 |
| Immigrants | Congo | 0.0 /100 | #333 | Tragic $44,204 |
Demographics Similar to Nepalese by Median Male Earnings
In terms of median male earnings, the demographic groups most similar to Nepalese are Cree ($49,497, a difference of 0.080%), Iroquois ($49,374, a difference of 0.17%), Liberian ($49,318, a difference of 0.28%), British West Indian ($49,636, a difference of 0.36%), and Immigrants from West Indies ($49,271, a difference of 0.38%).
| Demographics | Rating | Rank | Median Male Earnings |
| Immigrants | Cabo Verde | 1.2 /100 | #252 | Tragic $50,009 |
| German Russians | 1.1 /100 | #253 | Tragic $49,924 |
| Senegalese | 1.0 /100 | #254 | Tragic $49,774 |
| Alaskan Athabascans | 0.9 /100 | #255 | Tragic $49,748 |
| Alaska Natives | 0.9 /100 | #256 | Tragic $49,711 |
| British West Indians | 0.8 /100 | #257 | Tragic $49,636 |
| Cree | 0.7 /100 | #258 | Tragic $49,497 |
| Nepalese | 0.7 /100 | #259 | Tragic $49,458 |
| Iroquois | 0.7 /100 | #260 | Tragic $49,374 |
| Liberians | 0.6 /100 | #261 | Tragic $49,318 |
| Immigrants | West Indies | 0.6 /100 | #262 | Tragic $49,271 |
| Nicaraguans | 0.6 /100 | #263 | Tragic $49,215 |
| Immigrants | Middle Africa | 0.6 /100 | #264 | Tragic $49,201 |
| Immigrants | Laos | 0.6 /100 | #265 | Tragic $49,190 |
| Somalis | 0.5 /100 | #266 | Tragic $49,025 |