Immigrants from Guatemala vs Immigrants from Cabo Verde Per Capita Income
COMPARE
Immigrants from Guatemala
Immigrants from Cabo Verde
Per Capita Income
Per Capita Income Comparison
Immigrants from Guatemala
Immigrants from Cabo Verde
$37,550
PER CAPITA INCOME
0.1/ 100
METRIC RATING
290th/ 347
METRIC RANK
$38,540
PER CAPITA INCOME
0.3/ 100
METRIC RATING
272nd/ 347
METRIC RANK
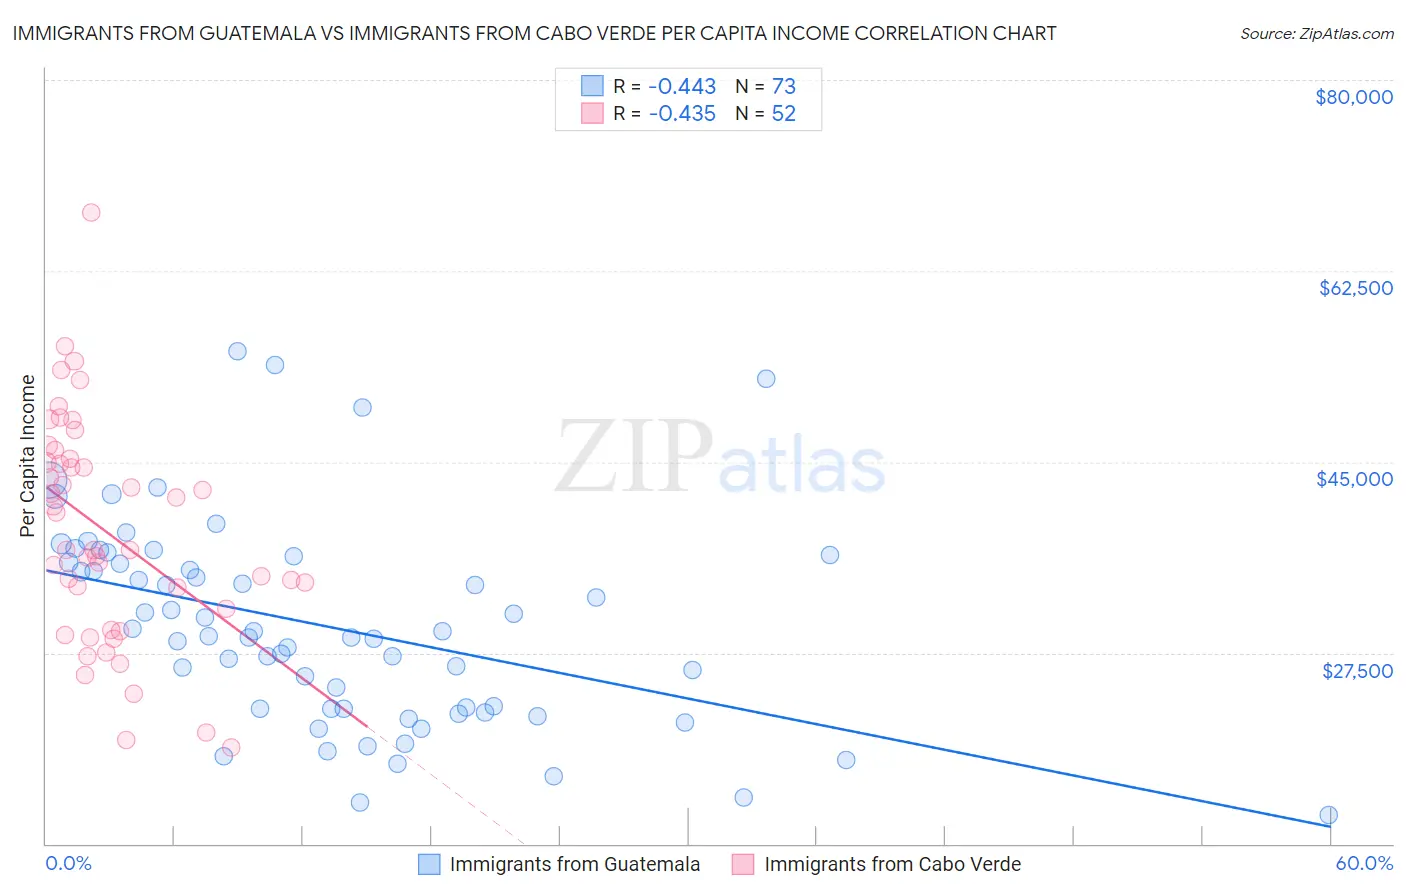
Immigrants from Guatemala vs Immigrants from Cabo Verde Per Capita Income Correlation Chart
The statistical analysis conducted on geographies consisting of 377,292,357 people shows a moderate negative correlation between the proportion of Immigrants from Guatemala and per capita income in the United States with a correlation coefficient (R) of -0.443 and weighted average of $37,550. Similarly, the statistical analysis conducted on geographies consisting of 38,153,224 people shows a moderate negative correlation between the proportion of Immigrants from Cabo Verde and per capita income in the United States with a correlation coefficient (R) of -0.435 and weighted average of $38,540, a difference of 2.6%.
Per Capita Income Correlation Summary
| Measurement | Immigrants from Guatemala | Immigrants from Cabo Verde |
| Minimum | $12,606 | $18,870 |
| Maximum | $55,157 | $67,818 |
| Range | $42,551 | $48,948 |
| Mean | $29,919 | $38,585 |
| Median | $29,061 | $36,913 |
| Interquartile 25% (IQ1) | $22,369 | $30,580 |
| Interquartile 75% (IQ3) | $36,058 | $45,064 |
| Interquartile Range (IQR) | $13,690 | $14,484 |
| Standard Deviation (Sample) | $9,360 | $10,185 |
| Standard Deviation (Population) | $9,296 | $10,087 |
Demographics Similar to Immigrants from Guatemala and Immigrants from Cabo Verde by Per Capita Income
In terms of per capita income, the demographic groups most similar to Immigrants from Guatemala are Cajun ($37,527, a difference of 0.060%), U.S. Virgin Islander ($37,589, a difference of 0.10%), Dominican ($37,697, a difference of 0.39%), Blackfeet ($37,695, a difference of 0.39%), and Central American Indian ($37,699, a difference of 0.40%). Similarly, the demographic groups most similar to Immigrants from Cabo Verde are Central American ($38,560, a difference of 0.050%), Nepalese ($38,442, a difference of 0.25%), Immigrants from El Salvador ($38,394, a difference of 0.38%), Immigrants from Liberia ($38,165, a difference of 0.98%), and Hmong ($38,120, a difference of 1.1%).
| Demographics | Rating | Rank | Per Capita Income |
| Central Americans | 0.3 /100 | #271 | Tragic $38,560 |
| Immigrants | Cabo Verde | 0.3 /100 | #272 | Tragic $38,540 |
| Nepalese | 0.3 /100 | #273 | Tragic $38,442 |
| Immigrants | El Salvador | 0.3 /100 | #274 | Tragic $38,394 |
| Immigrants | Liberia | 0.2 /100 | #275 | Tragic $38,165 |
| Hmong | 0.2 /100 | #276 | Tragic $38,120 |
| Comanche | 0.2 /100 | #277 | Tragic $38,088 |
| Immigrants | Nicaragua | 0.2 /100 | #278 | Tragic $38,065 |
| Colville | 0.2 /100 | #279 | Tragic $38,047 |
| Potawatomi | 0.2 /100 | #280 | Tragic $38,046 |
| Immigrants | Dominica | 0.2 /100 | #281 | Tragic $37,952 |
| Immigrants | Laos | 0.1 /100 | #282 | Tragic $37,857 |
| Pennsylvania Germans | 0.1 /100 | #283 | Tragic $37,842 |
| Africans | 0.1 /100 | #284 | Tragic $37,785 |
| Guatemalans | 0.1 /100 | #285 | Tragic $37,766 |
| Central American Indians | 0.1 /100 | #286 | Tragic $37,699 |
| Dominicans | 0.1 /100 | #287 | Tragic $37,697 |
| Blackfeet | 0.1 /100 | #288 | Tragic $37,695 |
| U.S. Virgin Islanders | 0.1 /100 | #289 | Tragic $37,589 |
| Immigrants | Guatemala | 0.1 /100 | #290 | Tragic $37,550 |
| Cajuns | 0.1 /100 | #291 | Tragic $37,527 |