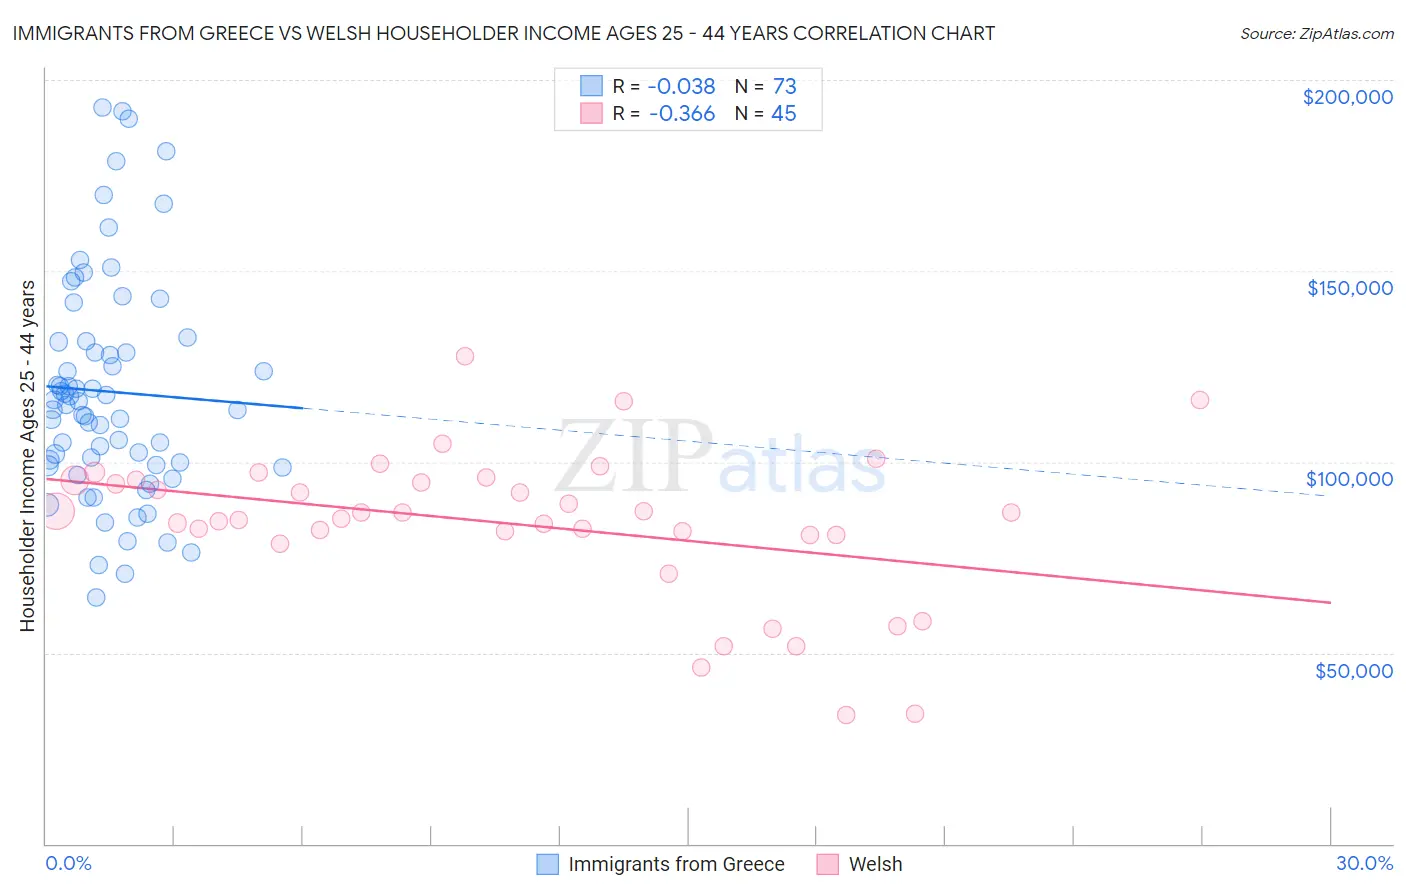
Immigrants from Greece vs Welsh Householder Income Ages 25 - 44 years
COMPARE
Immigrants from Greece
Welsh
Householder Income Ages 25 - 44 years
Householder Income Ages 25 - 44 years Comparison
Immigrants from Greece
Welsh
$110,103
HOUSEHOLDER INCOME AGES 25 - 44 YEARS
100.0/ 100
METRIC RATING
30th/ 347
METRIC RANK
$93,039
HOUSEHOLDER INCOME AGES 25 - 44 YEARS
30.0/ 100
METRIC RATING
190th/ 347
METRIC RANK
Immigrants from Greece vs Welsh Householder Income Ages 25 - 44 years Correlation Chart
The statistical analysis conducted on geographies consisting of 216,436,385 people shows no correlation between the proportion of Immigrants from Greece and household income with householder between the ages 25 and 44 in the United States with a correlation coefficient (R) of -0.038 and weighted average of $110,103. Similarly, the statistical analysis conducted on geographies consisting of 524,969,019 people shows a mild negative correlation between the proportion of Welsh and household income with householder between the ages 25 and 44 in the United States with a correlation coefficient (R) of -0.366 and weighted average of $93,039, a difference of 18.3%.
Householder Income Ages 25 - 44 years Correlation Summary
| Measurement | Immigrants from Greece | Welsh |
| Minimum | $64,496 | $33,750 |
| Maximum | $192,794 | $127,625 |
| Range | $128,298 | $93,875 |
| Mean | $118,398 | $83,695 |
| Median | $115,021 | $86,585 |
| Interquartile 25% (IQ1) | $99,078 | $80,749 |
| Interquartile 75% (IQ3) | $131,593 | $95,164 |
| Interquartile Range (IQR) | $32,516 | $14,415 |
| Standard Deviation (Sample) | $29,349 | $19,829 |
| Standard Deviation (Population) | $29,147 | $19,607 |
Similar Demographics by Householder Income Ages 25 - 44 years
Demographics Similar to Immigrants from Greece by Householder Income Ages 25 - 44 years
In terms of householder income ages 25 - 44 years, the demographic groups most similar to Immigrants from Greece are Maltese ($110,064, a difference of 0.040%), Turkish ($110,318, a difference of 0.20%), Immigrants from Denmark ($110,363, a difference of 0.24%), Russian ($110,398, a difference of 0.27%), and Immigrants from Sri Lanka ($109,741, a difference of 0.33%).
| Demographics | Rating | Rank | Householder Income Ages 25 - 44 years |
| Immigrants | Japan | 100.0 /100 | #23 | Exceptional $112,228 |
| Immigrants | Sweden | 100.0 /100 | #24 | Exceptional $112,010 |
| Immigrants | Northern Europe | 100.0 /100 | #25 | Exceptional $111,676 |
| Immigrants | Asia | 100.0 /100 | #26 | Exceptional $110,787 |
| Russians | 100.0 /100 | #27 | Exceptional $110,398 |
| Immigrants | Denmark | 100.0 /100 | #28 | Exceptional $110,363 |
| Turks | 100.0 /100 | #29 | Exceptional $110,318 |
| Immigrants | Greece | 100.0 /100 | #30 | Exceptional $110,103 |
| Maltese | 100.0 /100 | #31 | Exceptional $110,064 |
| Immigrants | Sri Lanka | 100.0 /100 | #32 | Exceptional $109,741 |
| Bhutanese | 100.0 /100 | #33 | Exceptional $109,520 |
| Bolivians | 100.0 /100 | #34 | Exceptional $109,372 |
| Immigrants | Switzerland | 100.0 /100 | #35 | Exceptional $109,185 |
| Latvians | 100.0 /100 | #36 | Exceptional $108,926 |
| Immigrants | Russia | 100.0 /100 | #37 | Exceptional $108,751 |
Demographics Similar to Welsh by Householder Income Ages 25 - 44 years
In terms of householder income ages 25 - 44 years, the demographic groups most similar to Welsh are Dutch ($93,081, a difference of 0.040%), Tlingit-Haida ($92,987, a difference of 0.060%), Immigrants from Sierra Leone ($93,115, a difference of 0.080%), Immigrants from Costa Rica ($92,876, a difference of 0.18%), and Spaniard ($93,366, a difference of 0.35%).
| Demographics | Rating | Rank | Householder Income Ages 25 - 44 years |
| Guamanians/Chamorros | 36.5 /100 | #183 | Fair $93,569 |
| Germans | 36.0 /100 | #184 | Fair $93,531 |
| Immigrants | Eritrea | 35.2 /100 | #185 | Fair $93,466 |
| Sierra Leoneans | 34.8 /100 | #186 | Fair $93,435 |
| Spaniards | 34.0 /100 | #187 | Fair $93,366 |
| Immigrants | Sierra Leone | 30.9 /100 | #188 | Fair $93,115 |
| Dutch | 30.5 /100 | #189 | Fair $93,081 |
| Welsh | 30.0 /100 | #190 | Fair $93,039 |
| Tlingit-Haida | 29.4 /100 | #191 | Fair $92,987 |
| Immigrants | Costa Rica | 28.2 /100 | #192 | Fair $92,876 |
| Samoans | 23.0 /100 | #193 | Fair $92,385 |
| Immigrants | Azores | 22.4 /100 | #194 | Fair $92,322 |
| Celtics | 21.6 /100 | #195 | Fair $92,241 |
| Immigrants | Colombia | 21.3 /100 | #196 | Fair $92,204 |
| Spanish | 21.2 /100 | #197 | Fair $92,200 |