Immigrants from Greece vs Swiss Median Household Income
COMPARE
Immigrants from Greece
Swiss
Median Household Income
Median Household Income Comparison
Immigrants from Greece
Swiss
$96,675
MEDIAN HOUSEHOLD INCOME
99.9/ 100
METRIC RATING
44th/ 347
METRIC RANK
$85,681
MEDIAN HOUSEHOLD INCOME
59.2/ 100
METRIC RATING
170th/ 347
METRIC RANK
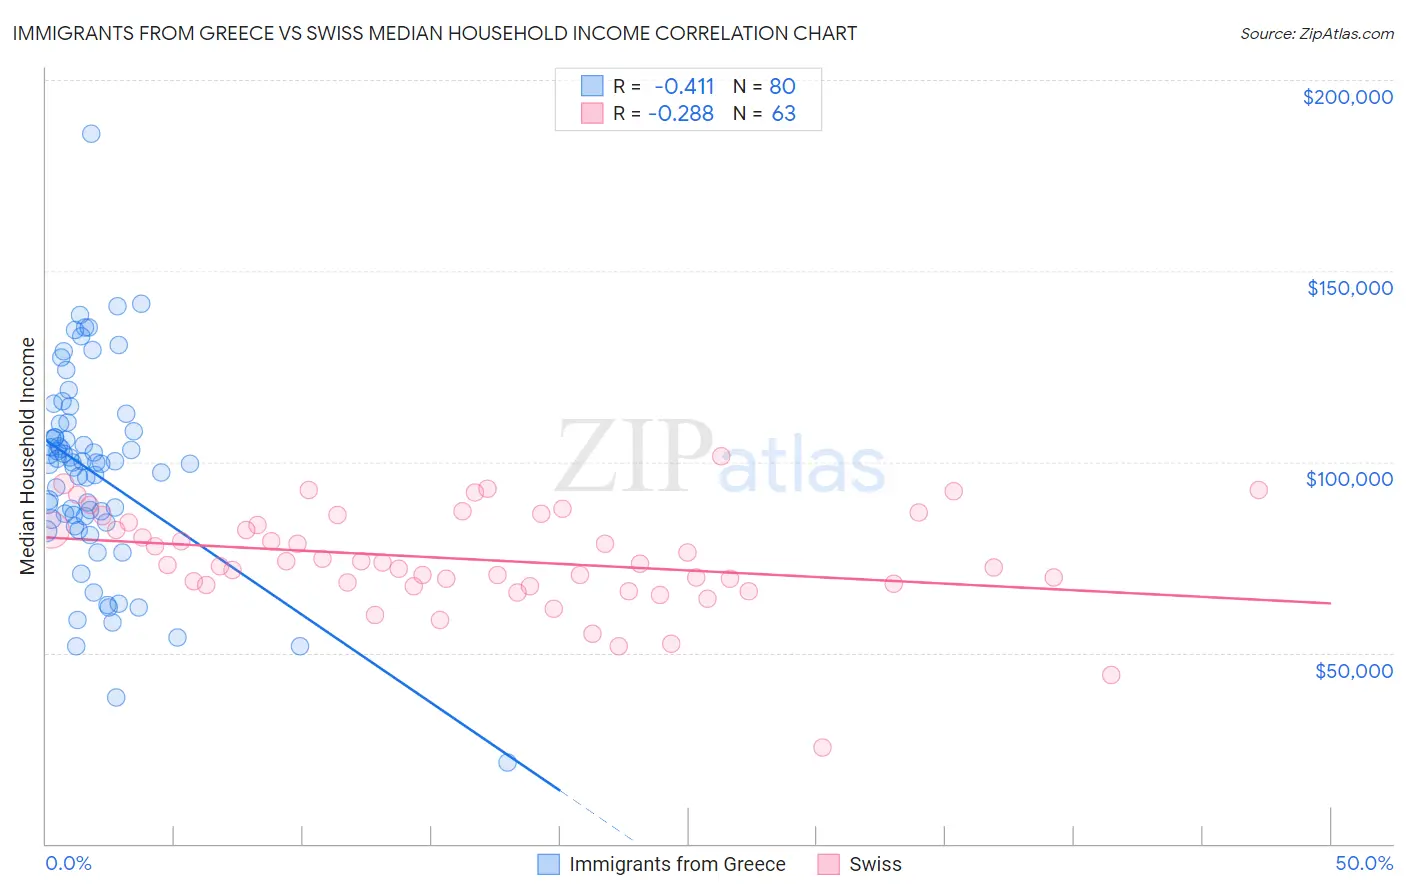
Immigrants from Greece vs Swiss Median Household Income Correlation Chart
The statistical analysis conducted on geographies consisting of 216,849,676 people shows a moderate negative correlation between the proportion of Immigrants from Greece and median household income in the United States with a correlation coefficient (R) of -0.411 and weighted average of $96,675. Similarly, the statistical analysis conducted on geographies consisting of 464,626,684 people shows a weak negative correlation between the proportion of Swiss and median household income in the United States with a correlation coefficient (R) of -0.288 and weighted average of $85,681, a difference of 12.8%.
Median Household Income Correlation Summary
| Measurement | Immigrants from Greece | Swiss |
| Minimum | $21,344 | $25,245 |
| Maximum | $185,804 | $101,562 |
| Range | $164,460 | $76,317 |
| Mean | $97,069 | $74,409 |
| Median | $99,595 | $73,303 |
| Interquartile 25% (IQ1) | $84,501 | $67,788 |
| Interquartile 75% (IQ3) | $109,048 | $84,144 |
| Interquartile Range (IQR) | $24,547 | $16,356 |
| Standard Deviation (Sample) | $26,271 | $13,178 |
| Standard Deviation (Population) | $26,106 | $13,073 |
Similar Demographics by Median Household Income
Demographics Similar to Immigrants from Greece by Median Household Income
In terms of median household income, the demographic groups most similar to Immigrants from Greece are Immigrants from France ($96,743, a difference of 0.070%), Israeli ($96,552, a difference of 0.13%), Immigrants from Lithuania ($96,836, a difference of 0.17%), Australian ($96,490, a difference of 0.19%), and Immigrants from Turkey ($96,964, a difference of 0.30%).
| Demographics | Rating | Rank | Median Household Income |
| Latvians | 100.0 /100 | #37 | Exceptional $97,311 |
| Immigrants | Indonesia | 100.0 /100 | #38 | Exceptional $97,297 |
| Afghans | 100.0 /100 | #39 | Exceptional $97,026 |
| Maltese | 100.0 /100 | #40 | Exceptional $97,015 |
| Immigrants | Turkey | 100.0 /100 | #41 | Exceptional $96,964 |
| Immigrants | Lithuania | 99.9 /100 | #42 | Exceptional $96,836 |
| Immigrants | France | 99.9 /100 | #43 | Exceptional $96,743 |
| Immigrants | Greece | 99.9 /100 | #44 | Exceptional $96,675 |
| Israelis | 99.9 /100 | #45 | Exceptional $96,552 |
| Australians | 99.9 /100 | #46 | Exceptional $96,490 |
| Immigrants | Russia | 99.9 /100 | #47 | Exceptional $96,378 |
| Cambodians | 99.9 /100 | #48 | Exceptional $96,324 |
| Immigrants | Malaysia | 99.9 /100 | #49 | Exceptional $96,292 |
| Bulgarians | 99.9 /100 | #50 | Exceptional $96,290 |
| Estonians | 99.9 /100 | #51 | Exceptional $95,930 |
Demographics Similar to Swiss by Median Household Income
In terms of median household income, the demographic groups most similar to Swiss are Colombian ($85,716, a difference of 0.040%), Immigrants from South America ($85,611, a difference of 0.080%), Icelander ($85,797, a difference of 0.14%), Slovene ($85,562, a difference of 0.14%), and Immigrants ($85,818, a difference of 0.16%).
| Demographics | Rating | Rank | Median Household Income |
| Czechs | 66.4 /100 | #163 | Good $86,164 |
| Irish | 66.2 /100 | #164 | Good $86,145 |
| Norwegians | 65.3 /100 | #165 | Good $86,084 |
| Scandinavians | 65.1 /100 | #166 | Good $86,073 |
| Immigrants | Immigrants | 61.3 /100 | #167 | Good $85,818 |
| Icelanders | 61.0 /100 | #168 | Good $85,797 |
| Colombians | 59.7 /100 | #169 | Average $85,716 |
| Swiss | 59.2 /100 | #170 | Average $85,681 |
| Immigrants | South America | 58.1 /100 | #171 | Average $85,611 |
| Slovenes | 57.4 /100 | #172 | Average $85,562 |
| Immigrants | Cameroon | 53.4 /100 | #173 | Average $85,314 |
| Scottish | 50.0 /100 | #174 | Average $85,101 |
| Immigrants | Costa Rica | 49.2 /100 | #175 | Average $85,054 |
| Alsatians | 49.2 /100 | #176 | Average $85,053 |
| Immigrants | Eritrea | 48.8 /100 | #177 | Average $85,025 |