Immigrants from Greece vs Jamaican Householder Income Under 25 years
COMPARE
Immigrants from Greece
Jamaican
Householder Income Under 25 years
Householder Income Under 25 years Comparison
Immigrants from Greece
Jamaicans
$55,727
HOUSEHOLDER INCOME UNDER 25 YEARS
100.0/ 100
METRIC RATING
40th/ 347
METRIC RANK
$50,929
HOUSEHOLDER INCOME UNDER 25 YEARS
4.4/ 100
METRIC RATING
230th/ 347
METRIC RANK
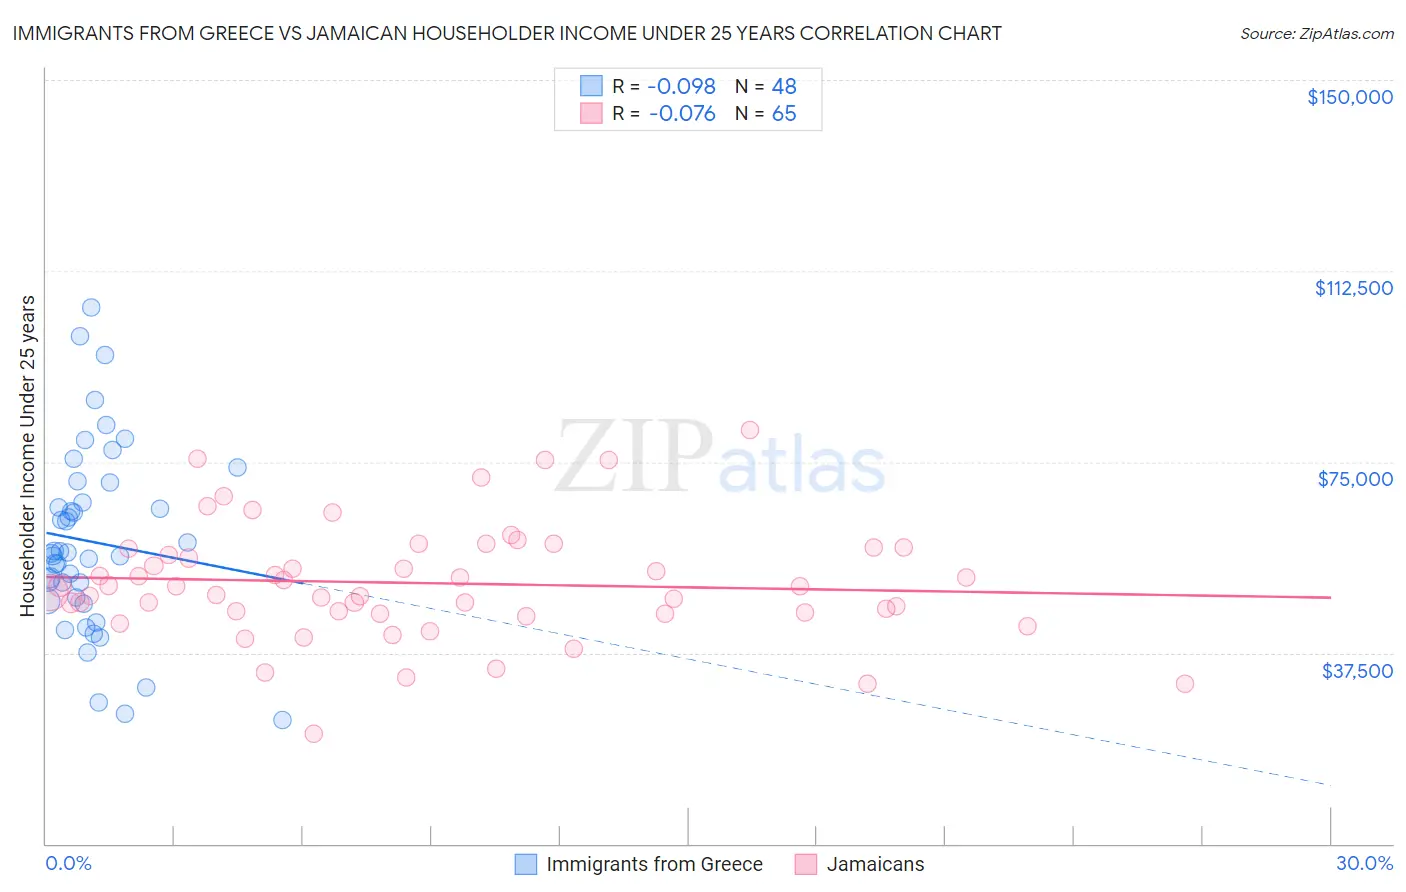
Immigrants from Greece vs Jamaican Householder Income Under 25 years Correlation Chart
The statistical analysis conducted on geographies consisting of 185,686,081 people shows a slight negative correlation between the proportion of Immigrants from Greece and household income with householder under the age of 25 in the United States with a correlation coefficient (R) of -0.098 and weighted average of $55,727. Similarly, the statistical analysis conducted on geographies consisting of 311,962,738 people shows a slight negative correlation between the proportion of Jamaicans and household income with householder under the age of 25 in the United States with a correlation coefficient (R) of -0.076 and weighted average of $50,929, a difference of 9.4%.
Householder Income Under 25 years Correlation Summary
| Measurement | Immigrants from Greece | Jamaican |
| Minimum | $24,293 | $21,667 |
| Maximum | $105,434 | $81,354 |
| Range | $81,141 | $59,687 |
| Mean | $59,276 | $51,206 |
| Median | $57,171 | $50,597 |
| Interquartile 25% (IQ1) | $47,996 | $45,297 |
| Interquartile 75% (IQ3) | $68,938 | $58,010 |
| Interquartile Range (IQR) | $20,942 | $12,713 |
| Standard Deviation (Sample) | $18,152 | $11,380 |
| Standard Deviation (Population) | $17,962 | $11,292 |
Similar Demographics by Householder Income Under 25 years
Demographics Similar to Immigrants from Greece by Householder Income Under 25 years
In terms of householder income under 25 years, the demographic groups most similar to Immigrants from Greece are Immigrants from Guyana ($55,726, a difference of 0.0%), Immigrants from Korea ($55,716, a difference of 0.020%), Immigrants from South Eastern Asia ($55,714, a difference of 0.020%), Immigrants from Belarus ($55,743, a difference of 0.030%), and Paraguayan ($55,614, a difference of 0.20%).
| Demographics | Rating | Rank | Householder Income Under 25 years |
| Inupiat | 100.0 /100 | #33 | Exceptional $55,935 |
| Immigrants | Japan | 100.0 /100 | #34 | Exceptional $55,932 |
| Tlingit-Haida | 100.0 /100 | #35 | Exceptional $55,914 |
| Immigrants | Israel | 100.0 /100 | #36 | Exceptional $55,913 |
| Immigrants | Russia | 100.0 /100 | #37 | Exceptional $55,891 |
| Immigrants | Iran | 100.0 /100 | #38 | Exceptional $55,880 |
| Immigrants | Belarus | 100.0 /100 | #39 | Exceptional $55,743 |
| Immigrants | Greece | 100.0 /100 | #40 | Exceptional $55,727 |
| Immigrants | Guyana | 100.0 /100 | #41 | Exceptional $55,726 |
| Immigrants | Korea | 100.0 /100 | #42 | Exceptional $55,716 |
| Immigrants | South Eastern Asia | 100.0 /100 | #43 | Exceptional $55,714 |
| Paraguayans | 100.0 /100 | #44 | Exceptional $55,614 |
| Spanish American Indians | 100.0 /100 | #45 | Exceptional $55,573 |
| Immigrants | Eastern Europe | 100.0 /100 | #46 | Exceptional $55,572 |
| Cambodians | 100.0 /100 | #47 | Exceptional $55,571 |
Demographics Similar to Jamaicans by Householder Income Under 25 years
In terms of householder income under 25 years, the demographic groups most similar to Jamaicans are Yuman ($50,933, a difference of 0.010%), Ugandan ($50,923, a difference of 0.010%), Slovene ($50,886, a difference of 0.080%), Immigrants from Norway ($50,984, a difference of 0.11%), and Pennsylvania German ($50,852, a difference of 0.15%).
| Demographics | Rating | Rank | Householder Income Under 25 years |
| Serbians | 6.6 /100 | #223 | Tragic $51,106 |
| Belizeans | 6.4 /100 | #224 | Tragic $51,094 |
| Immigrants | Jamaica | 5.6 /100 | #225 | Tragic $51,038 |
| Yugoslavians | 5.5 /100 | #226 | Tragic $51,028 |
| Immigrants | Central America | 5.4 /100 | #227 | Tragic $51,022 |
| Immigrants | Norway | 5.0 /100 | #228 | Tragic $50,984 |
| Yuman | 4.4 /100 | #229 | Tragic $50,933 |
| Jamaicans | 4.4 /100 | #230 | Tragic $50,929 |
| Ugandans | 4.3 /100 | #231 | Tragic $50,923 |
| Slovenes | 4.0 /100 | #232 | Tragic $50,886 |
| Pennsylvania Germans | 3.7 /100 | #233 | Tragic $50,852 |
| Kenyans | 3.3 /100 | #234 | Tragic $50,815 |
| Spanish | 3.3 /100 | #235 | Tragic $50,813 |
| English | 3.3 /100 | #236 | Tragic $50,805 |
| Germans | 3.3 /100 | #237 | Tragic $50,804 |