Immigrants from Greece vs Immigrants from Costa Rica Householder Income Ages 45 - 64 years
COMPARE
Immigrants from Greece
Immigrants from Costa Rica
Householder Income Ages 45 - 64 years
Householder Income Ages 45 - 64 years Comparison
Immigrants from Greece
Immigrants from Costa Rica
$113,548
HOUSEHOLDER INCOME AGES 45 - 64 YEARS
99.9/ 100
METRIC RATING
46th/ 347
METRIC RANK
$100,141
HOUSEHOLDER INCOME AGES 45 - 64 YEARS
47.7/ 100
METRIC RATING
176th/ 347
METRIC RANK
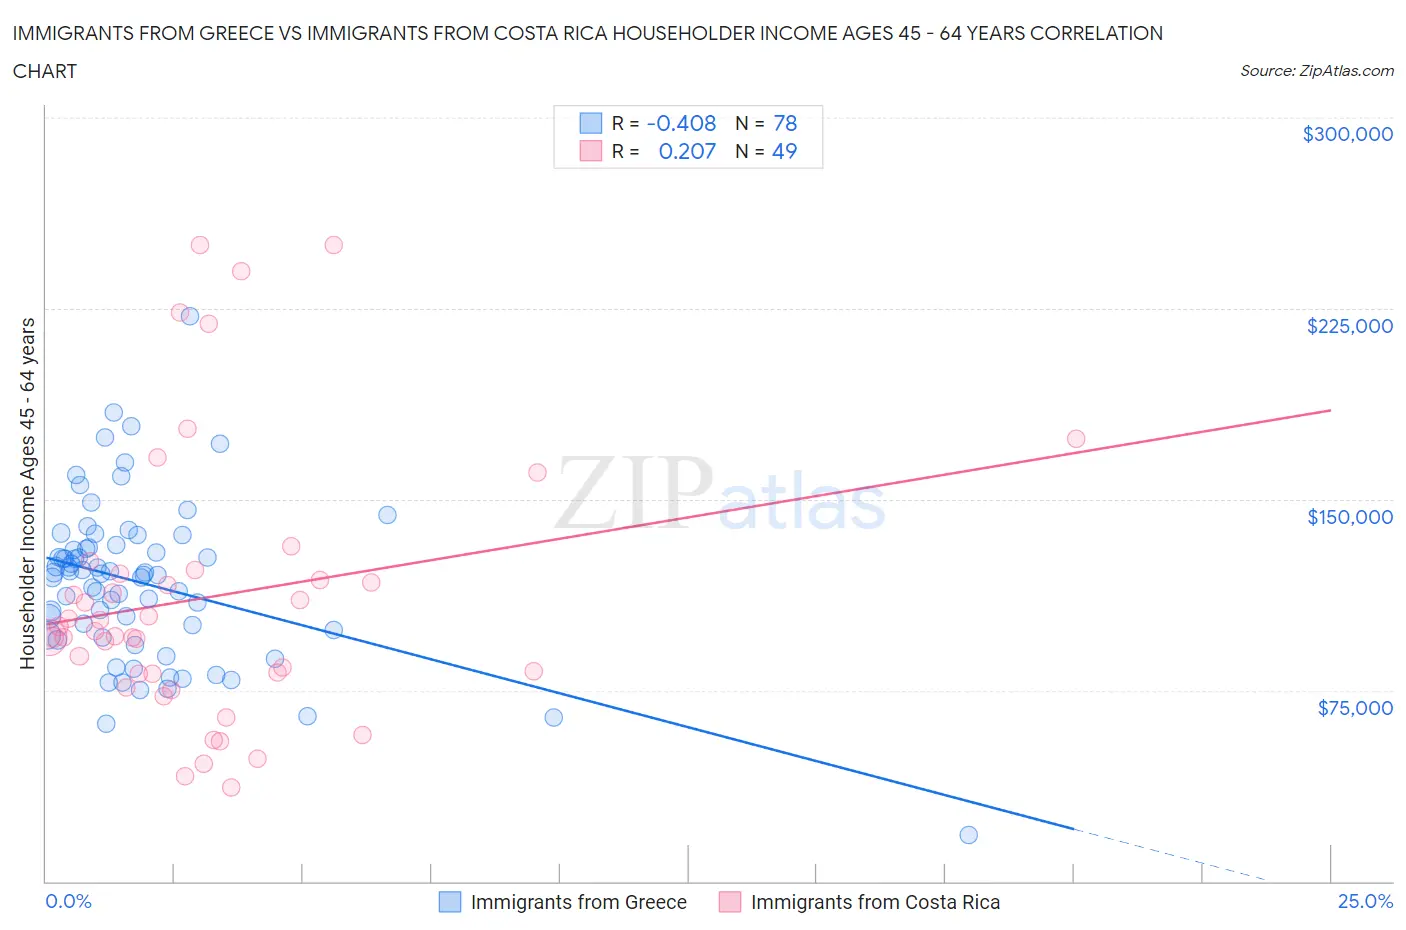
Immigrants from Greece vs Immigrants from Costa Rica Householder Income Ages 45 - 64 years Correlation Chart
The statistical analysis conducted on geographies consisting of 216,803,825 people shows a moderate negative correlation between the proportion of Immigrants from Greece and household income with householder between the ages 45 and 64 in the United States with a correlation coefficient (R) of -0.408 and weighted average of $113,548. Similarly, the statistical analysis conducted on geographies consisting of 204,163,177 people shows a weak positive correlation between the proportion of Immigrants from Costa Rica and household income with householder between the ages 45 and 64 in the United States with a correlation coefficient (R) of 0.207 and weighted average of $100,141, a difference of 13.4%.
Householder Income Ages 45 - 64 years Correlation Summary
| Measurement | Immigrants from Greece | Immigrants from Costa Rica |
| Minimum | $18,083 | $36,667 |
| Maximum | $222,000 | $250,001 |
| Range | $203,917 | $213,334 |
| Mean | $117,037 | $111,542 |
| Median | $120,719 | $98,012 |
| Interquartile 25% (IQ1) | $96,498 | $81,355 |
| Interquartile 75% (IQ3) | $131,127 | $121,642 |
| Interquartile Range (IQR) | $34,629 | $40,287 |
| Standard Deviation (Sample) | $31,775 | $53,037 |
| Standard Deviation (Population) | $31,571 | $52,493 |
Similar Demographics by Householder Income Ages 45 - 64 years
Demographics Similar to Immigrants from Greece by Householder Income Ages 45 - 64 years
In terms of householder income ages 45 - 64 years, the demographic groups most similar to Immigrants from Greece are Australian ($113,533, a difference of 0.010%), Immigrants from Indonesia ($113,519, a difference of 0.030%), Immigrants from France ($113,680, a difference of 0.12%), Bulgarian ($113,883, a difference of 0.29%), and Immigrants from Russia ($113,215, a difference of 0.29%).
| Demographics | Rating | Rank | Householder Income Ages 45 - 64 years |
| Immigrants | Turkey | 99.9 /100 | #39 | Exceptional $114,407 |
| Cambodians | 99.9 /100 | #40 | Exceptional $114,342 |
| Immigrants | Lithuania | 99.9 /100 | #41 | Exceptional $114,336 |
| Estonians | 99.9 /100 | #42 | Exceptional $114,220 |
| Israelis | 99.9 /100 | #43 | Exceptional $114,186 |
| Bulgarians | 99.9 /100 | #44 | Exceptional $113,883 |
| Immigrants | France | 99.9 /100 | #45 | Exceptional $113,680 |
| Immigrants | Greece | 99.9 /100 | #46 | Exceptional $113,548 |
| Australians | 99.9 /100 | #47 | Exceptional $113,533 |
| Immigrants | Indonesia | 99.9 /100 | #48 | Exceptional $113,519 |
| Immigrants | Russia | 99.8 /100 | #49 | Exceptional $113,215 |
| Immigrants | Austria | 99.8 /100 | #50 | Exceptional $113,140 |
| Immigrants | South Africa | 99.8 /100 | #51 | Exceptional $112,886 |
| Immigrants | Malaysia | 99.8 /100 | #52 | Exceptional $112,796 |
| Afghans | 99.8 /100 | #53 | Exceptional $112,676 |
Demographics Similar to Immigrants from Costa Rica by Householder Income Ages 45 - 64 years
In terms of householder income ages 45 - 64 years, the demographic groups most similar to Immigrants from Costa Rica are Moroccan ($100,138, a difference of 0.0%), Immigrants from Cameroon ($100,084, a difference of 0.060%), German ($100,224, a difference of 0.080%), Belgian ($100,060, a difference of 0.080%), and Aleut ($100,052, a difference of 0.090%).
| Demographics | Rating | Rank | Householder Income Ages 45 - 64 years |
| Guamanians/Chamorros | 60.5 /100 | #169 | Good $101,170 |
| Slovaks | 58.8 /100 | #170 | Average $101,029 |
| South Americans | 56.4 /100 | #171 | Average $100,837 |
| Immigrants | Uzbekistan | 52.5 /100 | #172 | Average $100,523 |
| Alsatians | 51.4 /100 | #173 | Average $100,435 |
| Welsh | 50.0 /100 | #174 | Average $100,322 |
| Germans | 48.8 /100 | #175 | Average $100,224 |
| Immigrants | Costa Rica | 47.7 /100 | #176 | Average $100,141 |
| Moroccans | 47.7 /100 | #177 | Average $100,138 |
| Immigrants | Cameroon | 47.0 /100 | #178 | Average $100,084 |
| Belgians | 46.7 /100 | #179 | Average $100,060 |
| Aleuts | 46.6 /100 | #180 | Average $100,052 |
| Immigrants | Immigrants | 45.3 /100 | #181 | Average $99,943 |
| Finns | 44.8 /100 | #182 | Average $99,904 |
| Spaniards | 44.6 /100 | #183 | Average $99,889 |