Immigrants from France vs Immigrants from Dominican Republic Median Household Income
COMPARE
Immigrants from France
Immigrants from Dominican Republic
Median Household Income
Median Household Income Comparison
Immigrants from France
Immigrants from Dominican Republic
$96,743
MEDIAN HOUSEHOLD INCOME
99.9/ 100
METRIC RATING
43rd/ 347
METRIC RANK
$70,208
MEDIAN HOUSEHOLD INCOME
0.0/ 100
METRIC RATING
319th/ 347
METRIC RANK
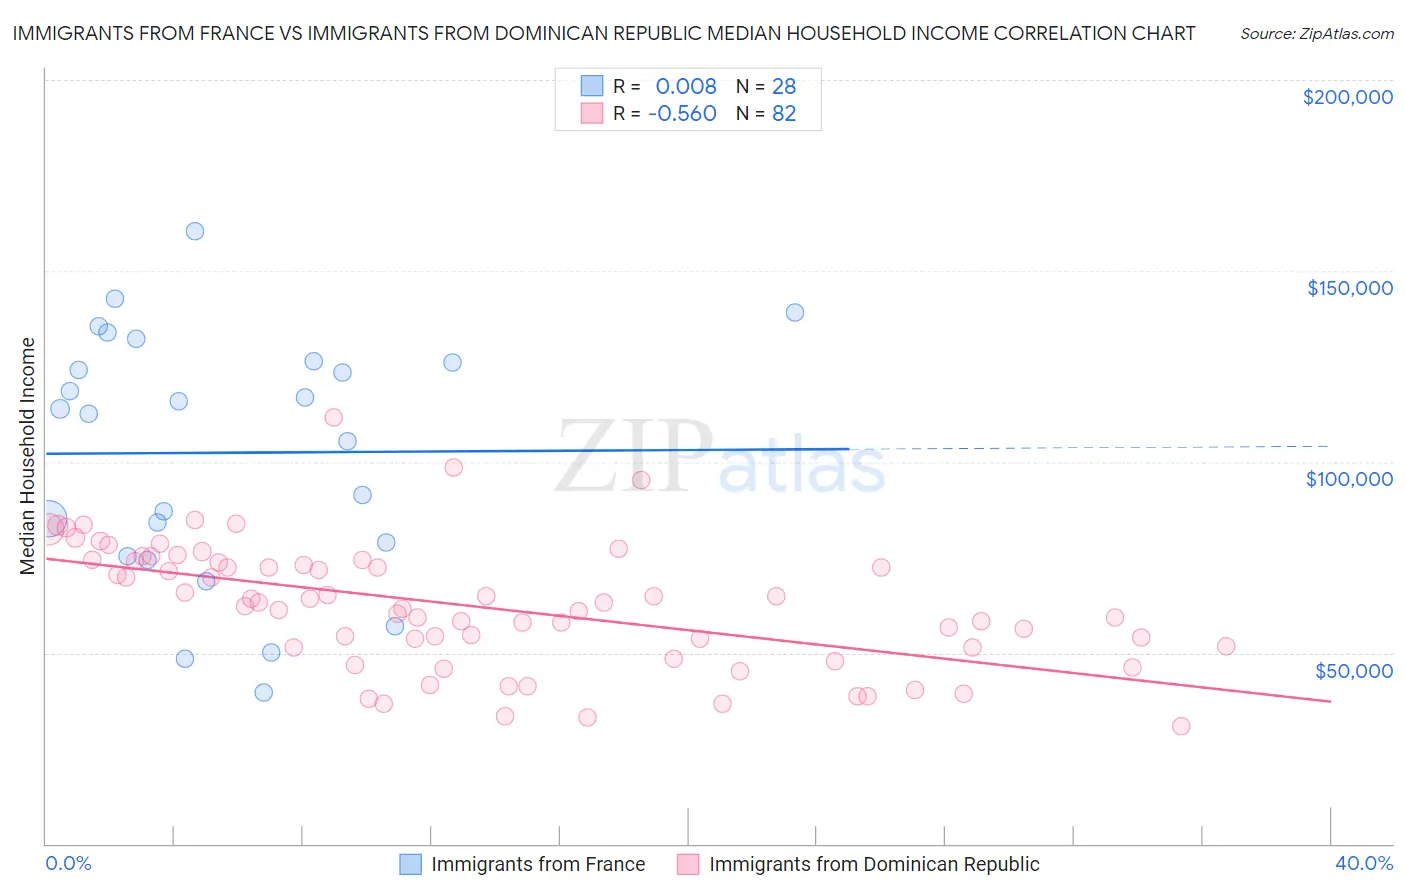
Immigrants from France vs Immigrants from Dominican Republic Median Household Income Correlation Chart
The statistical analysis conducted on geographies consisting of 287,829,118 people shows no correlation between the proportion of Immigrants from France and median household income in the United States with a correlation coefficient (R) of 0.008 and weighted average of $96,743. Similarly, the statistical analysis conducted on geographies consisting of 274,922,738 people shows a substantial negative correlation between the proportion of Immigrants from Dominican Republic and median household income in the United States with a correlation coefficient (R) of -0.560 and weighted average of $70,208, a difference of 37.8%.
Median Household Income Correlation Summary
| Measurement | Immigrants from France | Immigrants from Dominican Republic |
| Minimum | $39,667 | $30,696 |
| Maximum | $160,542 | $111,701 |
| Range | $120,875 | $81,005 |
| Mean | $102,392 | $62,334 |
| Median | $113,241 | $62,616 |
| Interquartile 25% (IQ1) | $77,070 | $51,486 |
| Interquartile 75% (IQ3) | $126,188 | $74,129 |
| Interquartile Range (IQR) | $49,118 | $22,642 |
| Standard Deviation (Sample) | $32,282 | $16,292 |
| Standard Deviation (Population) | $31,701 | $16,192 |
Similar Demographics by Median Household Income
Demographics Similar to Immigrants from France by Median Household Income
In terms of median household income, the demographic groups most similar to Immigrants from France are Immigrants from Greece ($96,675, a difference of 0.070%), Immigrants from Lithuania ($96,836, a difference of 0.10%), Israeli ($96,552, a difference of 0.20%), Immigrants from Turkey ($96,964, a difference of 0.23%), and Australian ($96,490, a difference of 0.26%).
| Demographics | Rating | Rank | Median Household Income |
| Immigrants | Pakistan | 100.0 /100 | #36 | Exceptional $97,528 |
| Latvians | 100.0 /100 | #37 | Exceptional $97,311 |
| Immigrants | Indonesia | 100.0 /100 | #38 | Exceptional $97,297 |
| Afghans | 100.0 /100 | #39 | Exceptional $97,026 |
| Maltese | 100.0 /100 | #40 | Exceptional $97,015 |
| Immigrants | Turkey | 100.0 /100 | #41 | Exceptional $96,964 |
| Immigrants | Lithuania | 99.9 /100 | #42 | Exceptional $96,836 |
| Immigrants | France | 99.9 /100 | #43 | Exceptional $96,743 |
| Immigrants | Greece | 99.9 /100 | #44 | Exceptional $96,675 |
| Israelis | 99.9 /100 | #45 | Exceptional $96,552 |
| Australians | 99.9 /100 | #46 | Exceptional $96,490 |
| Immigrants | Russia | 99.9 /100 | #47 | Exceptional $96,378 |
| Cambodians | 99.9 /100 | #48 | Exceptional $96,324 |
| Immigrants | Malaysia | 99.9 /100 | #49 | Exceptional $96,292 |
| Bulgarians | 99.9 /100 | #50 | Exceptional $96,290 |
Demographics Similar to Immigrants from Dominican Republic by Median Household Income
In terms of median household income, the demographic groups most similar to Immigrants from Dominican Republic are Colville ($70,094, a difference of 0.16%), Chickasaw ($70,005, a difference of 0.29%), Choctaw ($69,947, a difference of 0.37%), Chippewa ($70,539, a difference of 0.47%), and Cajun ($70,605, a difference of 0.56%).
| Demographics | Rating | Rank | Median Household Income |
| Immigrants | Honduras | 0.0 /100 | #312 | Tragic $71,452 |
| Immigrants | Bahamas | 0.0 /100 | #313 | Tragic $71,349 |
| Dominicans | 0.0 /100 | #314 | Tragic $71,302 |
| Ottawa | 0.0 /100 | #315 | Tragic $70,984 |
| Apache | 0.0 /100 | #316 | Tragic $70,927 |
| Cajuns | 0.0 /100 | #317 | Tragic $70,605 |
| Chippewa | 0.0 /100 | #318 | Tragic $70,539 |
| Immigrants | Dominican Republic | 0.0 /100 | #319 | Tragic $70,208 |
| Colville | 0.0 /100 | #320 | Tragic $70,094 |
| Chickasaw | 0.0 /100 | #321 | Tragic $70,005 |
| Choctaw | 0.0 /100 | #322 | Tragic $69,947 |
| Bahamians | 0.0 /100 | #323 | Tragic $69,726 |
| Yup'ik | 0.0 /100 | #324 | Tragic $69,695 |
| Seminole | 0.0 /100 | #325 | Tragic $69,420 |
| Yuman | 0.0 /100 | #326 | Tragic $68,743 |