Immigrants from France vs Immigrants from the Azores Median Earnings
COMPARE
Immigrants from France
Immigrants from the Azores
Median Earnings
Median Earnings Comparison
Immigrants from France
Immigrants from the Azores
$53,490
MEDIAN EARNINGS
100.0/ 100
METRIC RATING
28th/ 347
METRIC RANK
$45,812
MEDIAN EARNINGS
29.5/ 100
METRIC RATING
200th/ 347
METRIC RANK
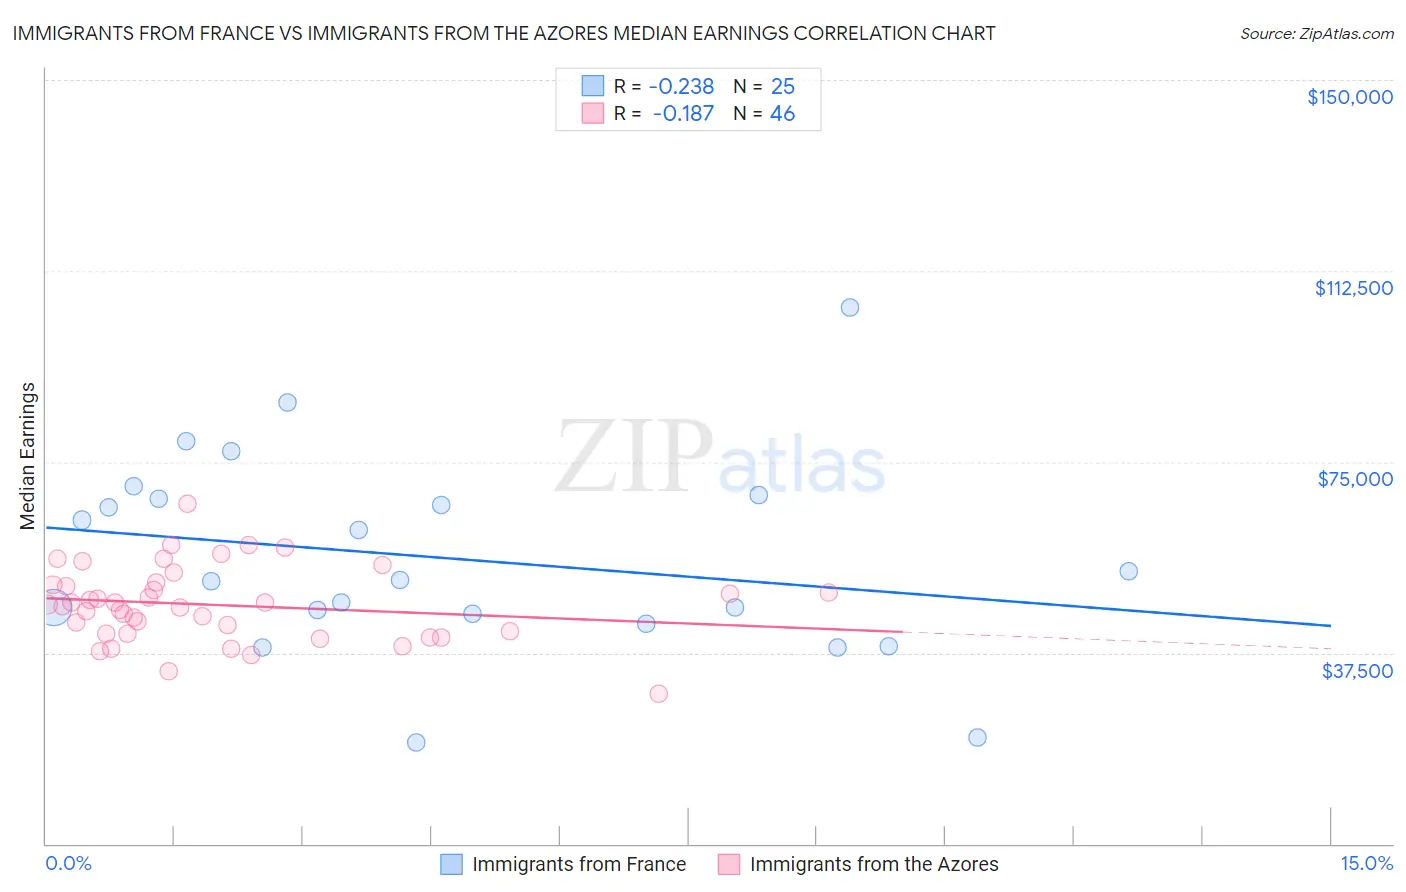
Immigrants from France vs Immigrants from the Azores Median Earnings Correlation Chart
The statistical analysis conducted on geographies consisting of 287,897,093 people shows a weak negative correlation between the proportion of Immigrants from France and median earnings in the United States with a correlation coefficient (R) of -0.238 and weighted average of $53,490. Similarly, the statistical analysis conducted on geographies consisting of 46,253,253 people shows a poor negative correlation between the proportion of Immigrants from the Azores and median earnings in the United States with a correlation coefficient (R) of -0.187 and weighted average of $45,812, a difference of 16.8%.
Median Earnings Correlation Summary
| Measurement | Immigrants from France | Immigrants from the Azores |
| Minimum | $19,781 | $29,500 |
| Maximum | $105,221 | $66,731 |
| Range | $85,440 | $37,231 |
| Mean | $56,012 | $46,892 |
| Median | $51,881 | $46,853 |
| Interquartile 25% (IQ1) | $44,190 | $41,350 |
| Interquartile 75% (IQ3) | $68,204 | $50,852 |
| Interquartile Range (IQR) | $24,013 | $9,501 |
| Standard Deviation (Sample) | $19,673 | $7,383 |
| Standard Deviation (Population) | $19,276 | $7,302 |
Similar Demographics by Median Earnings
Demographics Similar to Immigrants from France by Median Earnings
In terms of median earnings, the demographic groups most similar to Immigrants from France are Immigrants from Russia ($53,457, a difference of 0.060%), Cambodian ($53,386, a difference of 0.20%), Russian ($53,334, a difference of 0.29%), Immigrants from Asia ($53,310, a difference of 0.34%), and Asian ($53,690, a difference of 0.37%).
| Demographics | Rating | Rank | Median Earnings |
| Burmese | 100.0 /100 | #21 | Exceptional $54,559 |
| Immigrants | Korea | 100.0 /100 | #22 | Exceptional $54,530 |
| Immigrants | Sweden | 100.0 /100 | #23 | Exceptional $54,478 |
| Soviet Union | 100.0 /100 | #24 | Exceptional $54,290 |
| Turks | 100.0 /100 | #25 | Exceptional $53,919 |
| Immigrants | Northern Europe | 100.0 /100 | #26 | Exceptional $53,872 |
| Asians | 100.0 /100 | #27 | Exceptional $53,690 |
| Immigrants | France | 100.0 /100 | #28 | Exceptional $53,490 |
| Immigrants | Russia | 100.0 /100 | #29 | Exceptional $53,457 |
| Cambodians | 100.0 /100 | #30 | Exceptional $53,386 |
| Russians | 100.0 /100 | #31 | Exceptional $53,334 |
| Immigrants | Asia | 100.0 /100 | #32 | Exceptional $53,310 |
| Immigrants | Greece | 100.0 /100 | #33 | Exceptional $53,282 |
| Immigrants | Sri Lanka | 100.0 /100 | #34 | Exceptional $53,268 |
| Immigrants | Switzerland | 100.0 /100 | #35 | Exceptional $53,211 |
Demographics Similar to Immigrants from the Azores by Median Earnings
In terms of median earnings, the demographic groups most similar to Immigrants from the Azores are Immigrants from Barbados ($45,816, a difference of 0.010%), Trinidadian and Tobagonian ($45,820, a difference of 0.020%), Yugoslavian ($45,846, a difference of 0.070%), Barbadian ($45,846, a difference of 0.070%), and Celtic ($45,732, a difference of 0.18%).
| Demographics | Rating | Rank | Median Earnings |
| Guamanians/Chamorros | 33.2 /100 | #193 | Fair $45,933 |
| Immigrants | Costa Rica | 33.0 /100 | #194 | Fair $45,928 |
| Immigrants | St. Vincent and the Grenadines | 32.4 /100 | #195 | Fair $45,908 |
| Yugoslavians | 30.5 /100 | #196 | Fair $45,846 |
| Barbadians | 30.5 /100 | #197 | Fair $45,846 |
| Trinidadians and Tobagonians | 29.7 /100 | #198 | Fair $45,820 |
| Immigrants | Barbados | 29.6 /100 | #199 | Fair $45,816 |
| Immigrants | Azores | 29.5 /100 | #200 | Fair $45,812 |
| Celtics | 27.2 /100 | #201 | Fair $45,732 |
| Immigrants | Trinidad and Tobago | 27.1 /100 | #202 | Fair $45,729 |
| Welsh | 26.6 /100 | #203 | Fair $45,710 |
| Immigrants | Uruguay | 25.9 /100 | #204 | Fair $45,682 |
| Tongans | 25.4 /100 | #205 | Fair $45,665 |
| Immigrants | Ghana | 24.8 /100 | #206 | Fair $45,641 |
| Immigrants | Senegal | 24.0 /100 | #207 | Fair $45,611 |