Immigrants from Fiji vs Immigrants from Zimbabwe Householder Income Ages 45 - 64 years
COMPARE
Immigrants from Fiji
Immigrants from Zimbabwe
Householder Income Ages 45 - 64 years
Householder Income Ages 45 - 64 years Comparison
Immigrants from Fiji
Immigrants from Zimbabwe
$106,952
HOUSEHOLDER INCOME AGES 45 - 64 YEARS
96.5/ 100
METRIC RATING
107th/ 347
METRIC RANK
$104,992
HOUSEHOLDER INCOME AGES 45 - 64 YEARS
91.2/ 100
METRIC RATING
130th/ 347
METRIC RANK
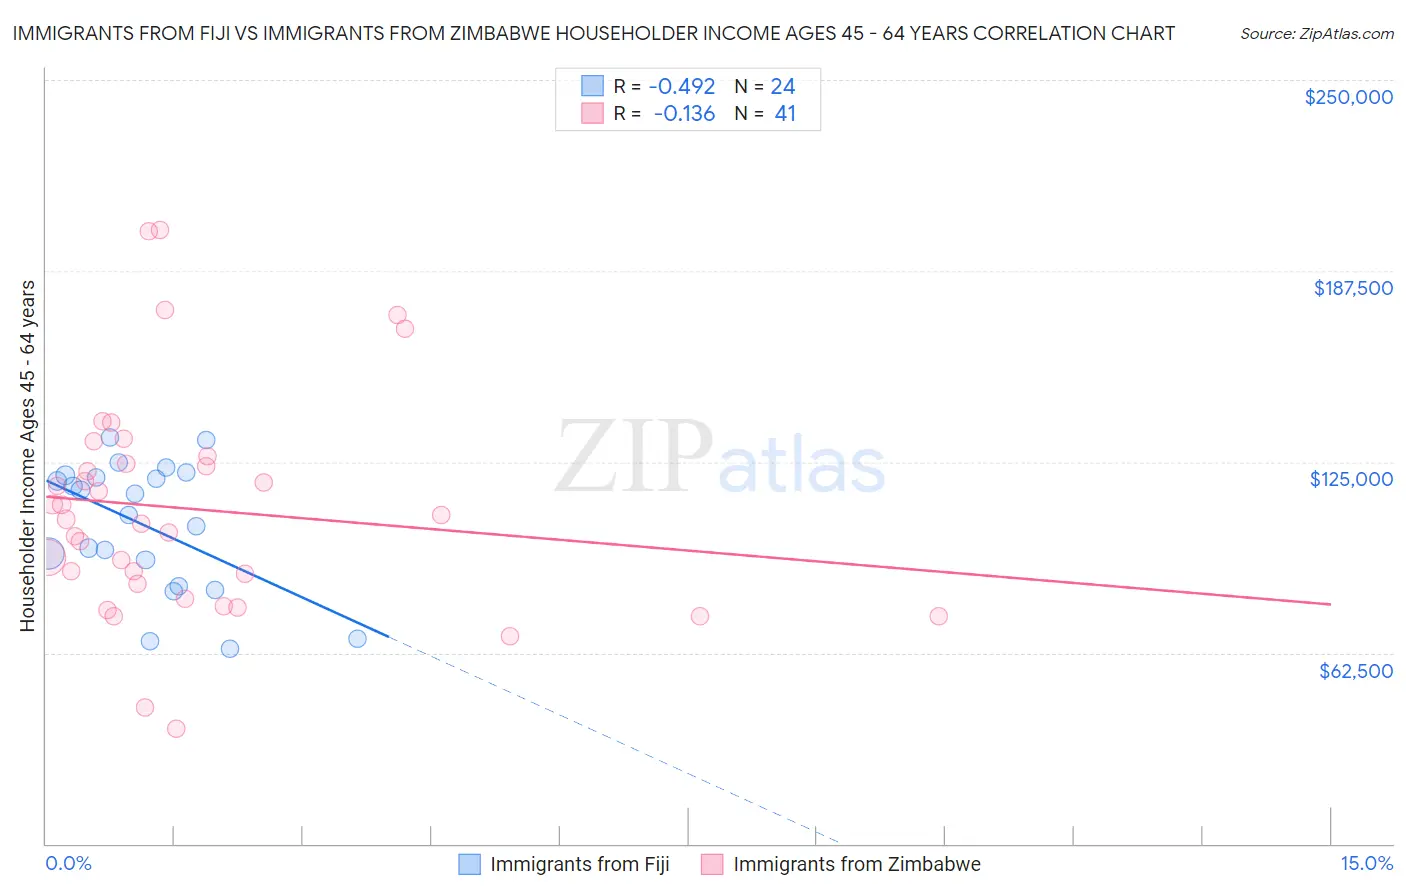
Immigrants from Fiji vs Immigrants from Zimbabwe Householder Income Ages 45 - 64 years Correlation Chart
The statistical analysis conducted on geographies consisting of 93,744,178 people shows a moderate negative correlation between the proportion of Immigrants from Fiji and household income with householder between the ages 45 and 64 in the United States with a correlation coefficient (R) of -0.492 and weighted average of $106,952. Similarly, the statistical analysis conducted on geographies consisting of 117,765,117 people shows a poor negative correlation between the proportion of Immigrants from Zimbabwe and household income with householder between the ages 45 and 64 in the United States with a correlation coefficient (R) of -0.136 and weighted average of $104,992, a difference of 1.9%.
Householder Income Ages 45 - 64 years Correlation Summary
| Measurement | Immigrants from Fiji | Immigrants from Zimbabwe |
| Minimum | $63,895 | $37,639 |
| Maximum | $132,819 | $200,729 |
| Range | $68,924 | $163,090 |
| Mean | $104,214 | $109,509 |
| Median | $111,173 | $106,206 |
| Interquartile 25% (IQ1) | $88,582 | $82,572 |
| Interquartile 75% (IQ3) | $120,299 | $125,652 |
| Interquartile Range (IQR) | $31,717 | $43,080 |
| Standard Deviation (Sample) | $21,039 | $36,656 |
| Standard Deviation (Population) | $20,596 | $36,206 |
Similar Demographics by Householder Income Ages 45 - 64 years
Demographics Similar to Immigrants from Fiji by Householder Income Ages 45 - 64 years
In terms of householder income ages 45 - 64 years, the demographic groups most similar to Immigrants from Fiji are Armenian ($107,002, a difference of 0.050%), Zimbabwean ($106,849, a difference of 0.10%), Macedonian ($107,074, a difference of 0.11%), Immigrants from Ukraine ($107,079, a difference of 0.12%), and Syrian ($107,207, a difference of 0.24%).
| Demographics | Rating | Rank | Householder Income Ages 45 - 64 years |
| Immigrants | Serbia | 97.4 /100 | #100 | Exceptional $107,569 |
| Immigrants | Kazakhstan | 97.2 /100 | #101 | Exceptional $107,378 |
| Immigrants | Moldova | 97.1 /100 | #102 | Exceptional $107,357 |
| Syrians | 96.9 /100 | #103 | Exceptional $107,207 |
| Immigrants | Ukraine | 96.7 /100 | #104 | Exceptional $107,079 |
| Macedonians | 96.7 /100 | #105 | Exceptional $107,074 |
| Armenians | 96.6 /100 | #106 | Exceptional $107,002 |
| Immigrants | Fiji | 96.5 /100 | #107 | Exceptional $106,952 |
| Zimbabweans | 96.3 /100 | #108 | Exceptional $106,849 |
| Chileans | 95.9 /100 | #109 | Exceptional $106,611 |
| Immigrants | Brazil | 95.6 /100 | #110 | Exceptional $106,470 |
| Immigrants | Vietnam | 95.5 /100 | #111 | Exceptional $106,417 |
| Swedes | 95.4 /100 | #112 | Exceptional $106,377 |
| Europeans | 95.4 /100 | #113 | Exceptional $106,367 |
| Immigrants | Poland | 95.3 /100 | #114 | Exceptional $106,319 |
Demographics Similar to Immigrants from Zimbabwe by Householder Income Ages 45 - 64 years
In terms of householder income ages 45 - 64 years, the demographic groups most similar to Immigrants from Zimbabwe are Peruvian ($105,070, a difference of 0.070%), Immigrants from Syria ($104,858, a difference of 0.13%), Native Hawaiian ($105,149, a difference of 0.15%), Immigrants from Saudi Arabia ($105,249, a difference of 0.24%), and Lebanese ($104,734, a difference of 0.25%).
| Demographics | Rating | Rank | Householder Income Ages 45 - 64 years |
| Danes | 93.4 /100 | #123 | Exceptional $105,619 |
| Immigrants | Northern Africa | 92.8 /100 | #124 | Exceptional $105,430 |
| Pakistanis | 92.4 /100 | #125 | Exceptional $105,317 |
| Portuguese | 92.4 /100 | #126 | Exceptional $105,309 |
| Immigrants | Saudi Arabia | 92.2 /100 | #127 | Exceptional $105,249 |
| Native Hawaiians | 91.8 /100 | #128 | Exceptional $105,149 |
| Peruvians | 91.5 /100 | #129 | Exceptional $105,070 |
| Immigrants | Zimbabwe | 91.2 /100 | #130 | Exceptional $104,992 |
| Immigrants | Syria | 90.7 /100 | #131 | Exceptional $104,858 |
| Lebanese | 90.1 /100 | #132 | Exceptional $104,734 |
| Arabs | 89.3 /100 | #133 | Excellent $104,566 |
| Canadians | 89.3 /100 | #134 | Excellent $104,560 |
| Brazilians | 88.6 /100 | #135 | Excellent $104,408 |
| Taiwanese | 87.4 /100 | #136 | Excellent $104,180 |
| Hungarians | 85.8 /100 | #137 | Excellent $103,913 |