Immigrants from Fiji vs Immigrants from Western Africa Median Family Income
COMPARE
Immigrants from Fiji
Immigrants from Western Africa
Median Family Income
Median Family Income Comparison
Immigrants from Fiji
Immigrants from Western Africa
$106,544
MEDIAN FAMILY INCOME
87.8/ 100
METRIC RATING
132nd/ 347
METRIC RANK
$94,638
MEDIAN FAMILY INCOME
1.6/ 100
METRIC RATING
234th/ 347
METRIC RANK
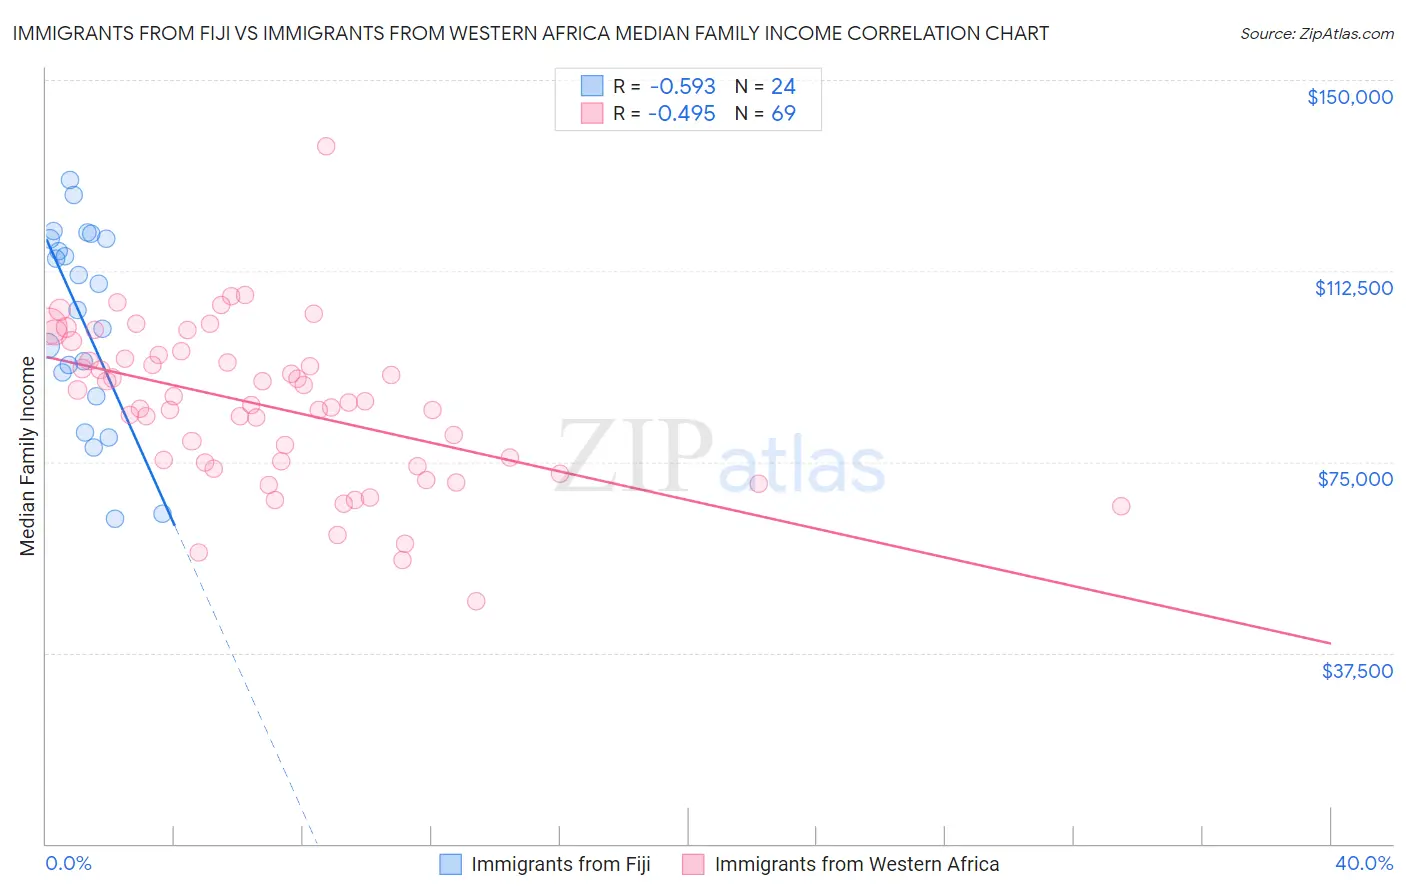
Immigrants from Fiji vs Immigrants from Western Africa Median Family Income Correlation Chart
The statistical analysis conducted on geographies consisting of 93,753,108 people shows a substantial negative correlation between the proportion of Immigrants from Fiji and median family income in the United States with a correlation coefficient (R) of -0.593 and weighted average of $106,544. Similarly, the statistical analysis conducted on geographies consisting of 357,410,586 people shows a moderate negative correlation between the proportion of Immigrants from Western Africa and median family income in the United States with a correlation coefficient (R) of -0.495 and weighted average of $94,638, a difference of 12.6%.
Median Family Income Correlation Summary
| Measurement | Immigrants from Fiji | Immigrants from Western Africa |
| Minimum | $63,924 | $47,599 |
| Maximum | $130,465 | $136,923 |
| Range | $66,540 | $89,324 |
| Mean | $102,660 | $85,944 |
| Median | $107,335 | $86,589 |
| Interquartile 25% (IQ1) | $90,188 | $74,581 |
| Interquartile 75% (IQ3) | $118,761 | $95,623 |
| Interquartile Range (IQR) | $28,573 | $21,043 |
| Standard Deviation (Sample) | $19,212 | $15,373 |
| Standard Deviation (Population) | $18,807 | $15,261 |
Similar Demographics by Median Family Income
Demographics Similar to Immigrants from Fiji by Median Family Income
In terms of median family income, the demographic groups most similar to Immigrants from Fiji are Ugandan ($106,541, a difference of 0.0%), Canadian ($106,597, a difference of 0.050%), Immigrants from Oceania ($106,453, a difference of 0.090%), Portuguese ($106,286, a difference of 0.24%), and Immigrants from South Eastern Asia ($106,252, a difference of 0.27%).
| Demographics | Rating | Rank | Median Family Income |
| Taiwanese | 91.4 /100 | #125 | Exceptional $107,295 |
| Serbians | 90.8 /100 | #126 | Exceptional $107,157 |
| Lebanese | 90.5 /100 | #127 | Exceptional $107,086 |
| Immigrants | Ethiopia | 90.0 /100 | #128 | Excellent $106,969 |
| Arabs | 89.9 /100 | #129 | Excellent $106,952 |
| Brazilians | 89.8 /100 | #130 | Excellent $106,942 |
| Canadians | 88.1 /100 | #131 | Excellent $106,597 |
| Immigrants | Fiji | 87.8 /100 | #132 | Excellent $106,544 |
| Ugandans | 87.8 /100 | #133 | Excellent $106,541 |
| Immigrants | Oceania | 87.3 /100 | #134 | Excellent $106,453 |
| Portuguese | 86.3 /100 | #135 | Excellent $106,286 |
| Immigrants | South Eastern Asia | 86.1 /100 | #136 | Excellent $106,252 |
| Immigrants | Uganda | 85.7 /100 | #137 | Excellent $106,188 |
| Immigrants | Vietnam | 85.7 /100 | #138 | Excellent $106,186 |
| Luxembourgers | 85.7 /100 | #139 | Excellent $106,183 |
Demographics Similar to Immigrants from Western Africa by Median Family Income
In terms of median family income, the demographic groups most similar to Immigrants from Western Africa are Immigrants from Bangladesh ($94,665, a difference of 0.030%), Immigrants from Burma/Myanmar ($94,472, a difference of 0.18%), Trinidadian and Tobagonian ($94,466, a difference of 0.18%), Alaskan Athabascan ($94,429, a difference of 0.22%), and Immigrants from Venezuela ($94,904, a difference of 0.28%).
| Demographics | Rating | Rank | Median Family Income |
| Alaska Natives | 2.6 /100 | #227 | Tragic $95,573 |
| Immigrants | Azores | 2.4 /100 | #228 | Tragic $95,402 |
| Marshallese | 2.2 /100 | #229 | Tragic $95,293 |
| Malaysians | 2.2 /100 | #230 | Tragic $95,230 |
| Ecuadorians | 2.1 /100 | #231 | Tragic $95,114 |
| Immigrants | Venezuela | 1.9 /100 | #232 | Tragic $94,904 |
| Immigrants | Bangladesh | 1.6 /100 | #233 | Tragic $94,665 |
| Immigrants | Western Africa | 1.6 /100 | #234 | Tragic $94,638 |
| Immigrants | Burma/Myanmar | 1.5 /100 | #235 | Tragic $94,472 |
| Trinidadians and Tobagonians | 1.5 /100 | #236 | Tragic $94,466 |
| Alaskan Athabascans | 1.5 /100 | #237 | Tragic $94,429 |
| Nepalese | 1.3 /100 | #238 | Tragic $94,153 |
| Salvadorans | 1.2 /100 | #239 | Tragic $94,109 |
| Somalis | 1.2 /100 | #240 | Tragic $94,085 |
| Immigrants | Trinidad and Tobago | 1.2 /100 | #241 | Tragic $93,988 |