Immigrants from Fiji vs Immigrants from Iran Householder Income Over 65 years

COMPARE

Immigrants from Fiji
Race
Ancestry
AfghanAfricanAlaska NativeAlaskan AthabascanAlbanianAleutAlsatianAmericanApacheArabArapahoArgentineanArmenianAssyrian/Chaldean/SyriacAustralianAustrianBahamianBangladeshiBarbadianBasqueBelgianBelizeanBermudanBhutaneseBlackfeetBolivianBrazilianBritishBritish West IndianBulgarianBurmeseCajunCambodianCanadianCape VerdeanCarpatho RusynCelticCentral AmericanCentral American IndianCherokeeCheyenneChickasawChileanChineseChippewaChoctawColombianColvilleComancheCosta RicanCreeCreekCroatianCrowCubanCypriotCzechCzechoslovakianDanishDelawareDominicanDutchDutch West IndianEastern EuropeanEcuadorianEgyptianEnglishEstonianEthiopianEuropeanFijianFilipinoFinnishFrenchFrench American IndianFrench CanadianGermanGerman RussianGhanaianGreekGuamanian/ChamorroGuatemalanGuyaneseHaitianHmongHonduranHopiHoumaHungarianIcelanderIndian (Asian)IndonesianInupiatIranianIraqiIrishIroquoisIsraeliItalianJamaicanJapaneseJordanianKenyanKiowaKoreanLaotianLatvianLebaneseLiberianLithuanianLumbeeLuxembourgerMacedonianMalaysianMalteseMarshalleseMenomineeMexicanMexican American IndianMongolianMoroccanNative HawaiianNavajoNepaleseNew ZealanderNicaraguanNigerianNorthern EuropeanNorwegianOkinawanOsageOttawaPaiutePakistaniPalestinianPanamanianParaguayanPennsylvania GermanPeruvianPimaPolishPortuguesePotawatomiPuebloPuerto RicanPuget Sound SalishRomanianRussianSalvadoranSamoanScandinavianScotch-IrishScottishSeminoleSenegaleseSerbianShoshoneSierra LeoneanSiouxSlavicSlovakSloveneSomaliSouth AfricanSouth AmericanSouth American IndianSoviet UnionSpaniardSpanishSpanish AmericanSpanish American IndianSri LankanSubsaharan AfricanSudaneseSwedishSwissSyrianTaiwaneseThaiTlingit-HaidaTohono O'OdhamTonganTrinidadian and TobagonianTsimshianTurkishU.S. Virgin IslanderUgandanUkrainianUruguayanUteVenezuelanVietnameseWelshWest IndianYakamaYaquiYugoslavianYumanYup'ikZimbabwean
Immigration
NonimmigrantsImmigrantsAfghanistanAfricaAlbaniaArgentinaArmeniaAsiaAustraliaAustriaBahamasBangladeshBarbadosBelarusBelgiumBelizeBoliviaBosnia and HerzegovinaBrazilBulgariaBurma/MyanmarCabo VerdeCambodiaCameroonCanadaCaribbeanCentral AmericaChileChinaColombiaCongoCosta RicaCroatiaCubaCzechoslovakiaDenmarkDominicaDominican RepublicEastern AfricaEastern AsiaEastern EuropeEcuadorEgyptEl SalvadorEnglandEritreaEthiopiaEuropeFijiFranceGermanyGhanaGreeceGrenadaGuatemalaGuyanaHaitiHondurasHong KongHungaryIndiaIndonesiaIraqIrelandIsraelItalyJamaicaJapanJordanKazakhstanKenyaKoreaKuwaitLaosLatin AmericaLatviaLebanonLiberiaLithuaniaMalaysiaMexicoMicronesiaMiddle AfricaMoldovaMoroccoNepalNetherlandsNicaraguaNigeriaNorth AmericaNorth MacedoniaNorthern AfricaNorthern EuropeNorwayOceaniaPakistanPanamaPeruPhilippinesPolandPortugalRomaniaRussiaSaudi ArabiaScotlandSenegalSerbiaSierra LeoneSingaporeSomaliaSouth AfricaSouth AmericaSouth Central AsiaSouth Eastern AsiaSouthern EuropeSpainSri LankaSt. Vincent and the GrenadinesSudanSwedenSwitzerlandSyriaTaiwanThailandTrinidad and TobagoTurkeyUgandaUkraineUruguayUzbekistanVenezuelaVietnamWest IndiesWestern AfricaWestern AsiaWestern EuropeYemenZaireZimbabweAzores
Immigrants from Iran
Race
Ancestry
AfghanAfricanAlaska NativeAlaskan AthabascanAlbanianAleutAlsatianAmericanApacheArabArapahoArgentineanArmenianAssyrian/Chaldean/SyriacAustralianAustrianBahamianBangladeshiBarbadianBasqueBelgianBelizeanBermudanBhutaneseBlackfeetBolivianBrazilianBritishBritish West IndianBulgarianBurmeseCajunCambodianCanadianCape VerdeanCarpatho RusynCelticCentral AmericanCentral American IndianCherokeeCheyenneChickasawChileanChineseChippewaChoctawColombianColvilleComancheCosta RicanCreeCreekCroatianCrowCubanCypriotCzechCzechoslovakianDanishDelawareDominicanDutchDutch West IndianEastern EuropeanEcuadorianEgyptianEnglishEstonianEthiopianEuropeanFijianFilipinoFinnishFrenchFrench American IndianFrench CanadianGermanGerman RussianGhanaianGreekGuamanian/ChamorroGuatemalanGuyaneseHaitianHmongHonduranHopiHoumaHungarianIcelanderIndian (Asian)IndonesianInupiatIranianIraqiIrishIroquoisIsraeliItalianJamaicanJapaneseJordanianKenyanKiowaKoreanLaotianLatvianLebaneseLiberianLithuanianLumbeeLuxembourgerMacedonianMalaysianMalteseMarshalleseMenomineeMexicanMexican American IndianMongolianMoroccanNative HawaiianNavajoNepaleseNew ZealanderNicaraguanNigerianNorthern EuropeanNorwegianOkinawanOsageOttawaPaiutePakistaniPalestinianPanamanianParaguayanPennsylvania GermanPeruvianPimaPolishPortuguesePotawatomiPuebloPuerto RicanPuget Sound SalishRomanianRussianSalvadoranSamoanScandinavianScotch-IrishScottishSeminoleSenegaleseSerbianShoshoneSierra LeoneanSiouxSlavicSlovakSloveneSomaliSouth AfricanSouth AmericanSouth American IndianSoviet UnionSpaniardSpanishSpanish AmericanSpanish American IndianSri LankanSubsaharan AfricanSudaneseSwedishSwissSyrianTaiwaneseThaiTlingit-HaidaTohono O'OdhamTonganTrinidadian and TobagonianTsimshianTurkishU.S. Virgin IslanderUgandanUkrainianUruguayanUteVenezuelanVietnameseWelshWest IndianYakamaYaquiYugoslavianYumanYup'ikZimbabwean
Immigration
NonimmigrantsImmigrantsAfghanistanAfricaAlbaniaArgentinaArmeniaAsiaAustraliaAustriaBahamasBangladeshBarbadosBelarusBelgiumBelizeBoliviaBosnia and HerzegovinaBrazilBulgariaBurma/MyanmarCabo VerdeCambodiaCameroonCanadaCaribbeanCentral AmericaChileChinaColombiaCongoCosta RicaCroatiaCubaCzechoslovakiaDenmarkDominicaDominican RepublicEastern AfricaEastern AsiaEastern EuropeEcuadorEgyptEl SalvadorEnglandEritreaEthiopiaEuropeFranceGermanyGhanaGreeceGrenadaGuatemalaGuyanaHaitiHondurasHong KongHungaryIndiaIndonesiaIranIraqIrelandIsraelItalyJamaicaJapanJordanKazakhstanKenyaKoreaKuwaitLaosLatin AmericaLatviaLebanonLiberiaLithuaniaMalaysiaMexicoMicronesiaMiddle AfricaMoldovaMoroccoNepalNetherlandsNicaraguaNigeriaNorth AmericaNorth MacedoniaNorthern AfricaNorthern EuropeNorwayOceaniaPakistanPanamaPeruPhilippinesPolandPortugalRomaniaRussiaSaudi ArabiaScotlandSenegalSerbiaSierra LeoneSingaporeSomaliaSouth AfricaSouth AmericaSouth Central AsiaSouth Eastern AsiaSouthern EuropeSpainSri LankaSt. Vincent and the GrenadinesSudanSwedenSwitzerlandSyriaTaiwanThailandTrinidad and TobagoTurkeyUgandaUkraineUruguayUzbekistanVenezuelaVietnamWest IndiesWestern AfricaWestern AsiaWestern EuropeYemenZaireZimbabweAzores
Householder Income Over 65 years
Income
Poverty
Unemployment
Labor Participation
Family Structure
Vehicle Availability
Education Level
Disability

Householder Income Over 65 years Comparison

Immigrants from Fiji

Immigrants from Iran

Exceptional
Exceptional
$64,795
HOUSEHOLDER INCOME OVER 65 YEARS
98.2/ 100
METRIC RATING
82nd/ 347
METRIC RANK
$75,081
HOUSEHOLDER INCOME OVER 65 YEARS
100.0/ 100
METRIC RATING
5th/ 347
METRIC RANK

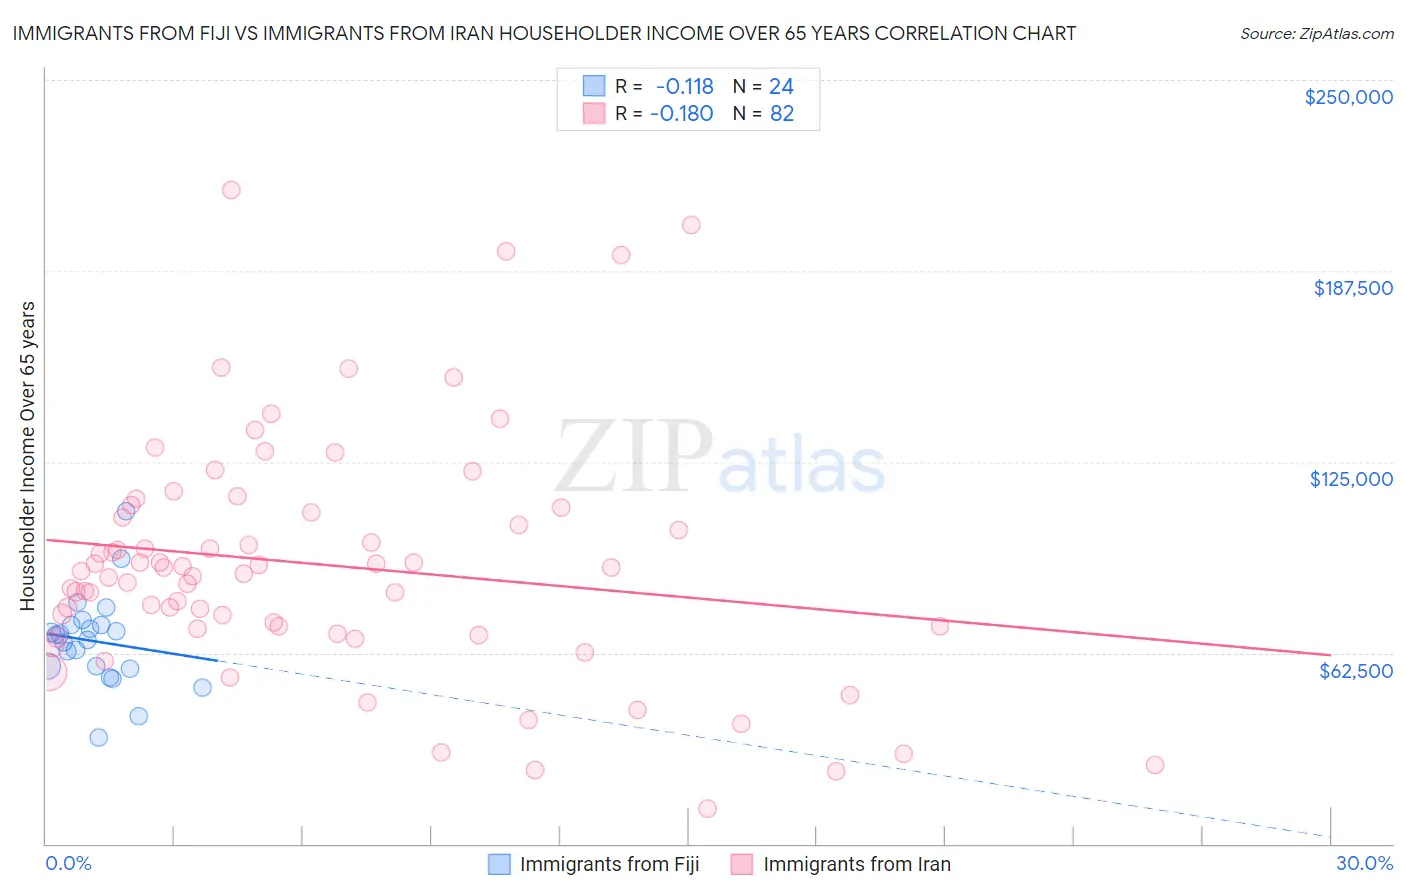
Immigrants from Fiji vs Immigrants from Iran Householder Income Over 65 years Correlation Chart

The statistical analysis conducted on geographies consisting of 93,711,523 people shows a poor negative correlation between the proportion of Immigrants from Fiji and household income with householder over the age of 65 in the United States with a correlation coefficient (R) of -0.118 and weighted average of $64,795. Similarly, the statistical analysis conducted on geographies consisting of 279,536,688 people shows a poor negative correlation between the proportion of Immigrants from Iran and household income with householder over the age of 65 in the United States with a correlation coefficient (R) of -0.180 and weighted average of $75,081, a difference of 15.9%.
Immigrants from Fiji vs Immigrants from Iran Householder Income Over 65 years

Householder Income Over 65 years Correlation Summary

MeasurementImmigrants from FijiImmigrants from Iran
Minimum$34,792$11,563
Maximum$108,977$214,063
Range$74,185$202,500
Mean$66,250$91,354
Median$67,555$88,665
Interquartile 25% (IQ1)$57,741$70,285
Interquartile 75% (IQ3)$71,770$108,269
Interquartile Range (IQR)$14,029$37,985
Standard Deviation (Sample)$15,202$39,442
Standard Deviation (Population)$14,882$39,201

Similar Demographics by Householder Income Over 65 years

Demographics Similar to Immigrants from Fiji by Householder Income Over 65 years

In terms of householder income over 65 years, the demographic groups most similar to Immigrants from Fiji are Immigrants from Europe ($64,828, a difference of 0.050%), Immigrants from North America ($64,856, a difference of 0.090%), Hawaiian ($64,920, a difference of 0.19%), Immigrants from Western Europe ($64,933, a difference of 0.21%), and Northern European ($64,658, a difference of 0.21%).
DemographicsRating | RankHouseholder Income Over 65 years
Sierra Leoneans
98.6
/100
|
#75
Exceptional
$65,038
Ethiopians
98.5
/100
|
#76
Exceptional
$64,989
Immigrants | Canada
98.5
/100
|
#77
Exceptional
$64,952
Immigrants | Western Europe
98.5
/100
|
#78
Exceptional
$64,933
Hawaiians
98.4
/100
|
#79
Exceptional
$64,920
Immigrants | North America
98.3
/100
|
#80
Exceptional
$64,856
Immigrants | Europe
98.3
/100
|
#81
Exceptional
$64,828
Immigrants | Fiji
98.2
/100
|
#82
Exceptional
$64,795
Northern Europeans
97.9
/100
|
#83
Exceptional
$64,658
Immigrants | Greece
97.9
/100
|
#84
Exceptional
$64,636
Immigrants | Lebanon
97.6
/100
|
#85
Exceptional
$64,521
Immigrants | Russia
97.6
/100
|
#86
Exceptional
$64,512
Austrians
97.5
/100
|
#87
Exceptional
$64,470
Immigrants | Romania
97.5
/100
|
#88
Exceptional
$64,462
Paraguayans
97.4
/100
|
#89
Exceptional
$64,443

Demographics Similar to Immigrants from Iran by Householder Income Over 65 years

In terms of householder income over 65 years, the demographic groups most similar to Immigrants from Iran are Bolivian ($74,245, a difference of 1.1%), Filipino ($76,686, a difference of 2.1%), Immigrants from Bolivia ($73,434, a difference of 2.2%), Immigrants from Taiwan ($77,051, a difference of 2.6%), and Immigrants from Singapore ($72,963, a difference of 2.9%).
DemographicsRating | RankHouseholder Income Over 65 years
Chinese
100.0
/100
|
#1
Exceptional
$77,465
Iranians
100.0
/100
|
#2
Exceptional
$77,429
Immigrants | Taiwan
100.0
/100
|
#3
Exceptional
$77,051
Filipinos
100.0
/100
|
#4
Exceptional
$76,686
Immigrants | Iran
100.0
/100
|
#5
Exceptional
$75,081
Bolivians
100.0
/100
|
#6
Exceptional
$74,245
Immigrants | Bolivia
100.0
/100
|
#7
Exceptional
$73,434
Immigrants | Singapore
100.0
/100
|
#8
Exceptional
$72,963
Immigrants | India
100.0
/100
|
#9
Exceptional
$72,804
Bhutanese
100.0
/100
|
#10
Exceptional
$72,288
Thais
100.0
/100
|
#11
Exceptional
$72,099
Cypriots
100.0
/100
|
#12
Exceptional
$71,714
Immigrants | Hong Kong
100.0
/100
|
#13
Exceptional
$71,567
Burmese
100.0
/100
|
#14
Exceptional
$71,139
Native Hawaiians
100.0
/100
|
#15
Exceptional
$71,021