Immigrants from Ethiopia vs Immigrants from Saudi Arabia Householder Income Ages 45 - 64 years
COMPARE
Immigrants from Ethiopia
Immigrants from Saudi Arabia
Householder Income Ages 45 - 64 years
Householder Income Ages 45 - 64 years Comparison
Immigrants from Ethiopia
Immigrants from Saudi Arabia
$102,763
HOUSEHOLDER INCOME AGES 45 - 64 YEARS
77.3/ 100
METRIC RATING
157th/ 347
METRIC RANK
$105,249
HOUSEHOLDER INCOME AGES 45 - 64 YEARS
92.2/ 100
METRIC RATING
127th/ 347
METRIC RANK
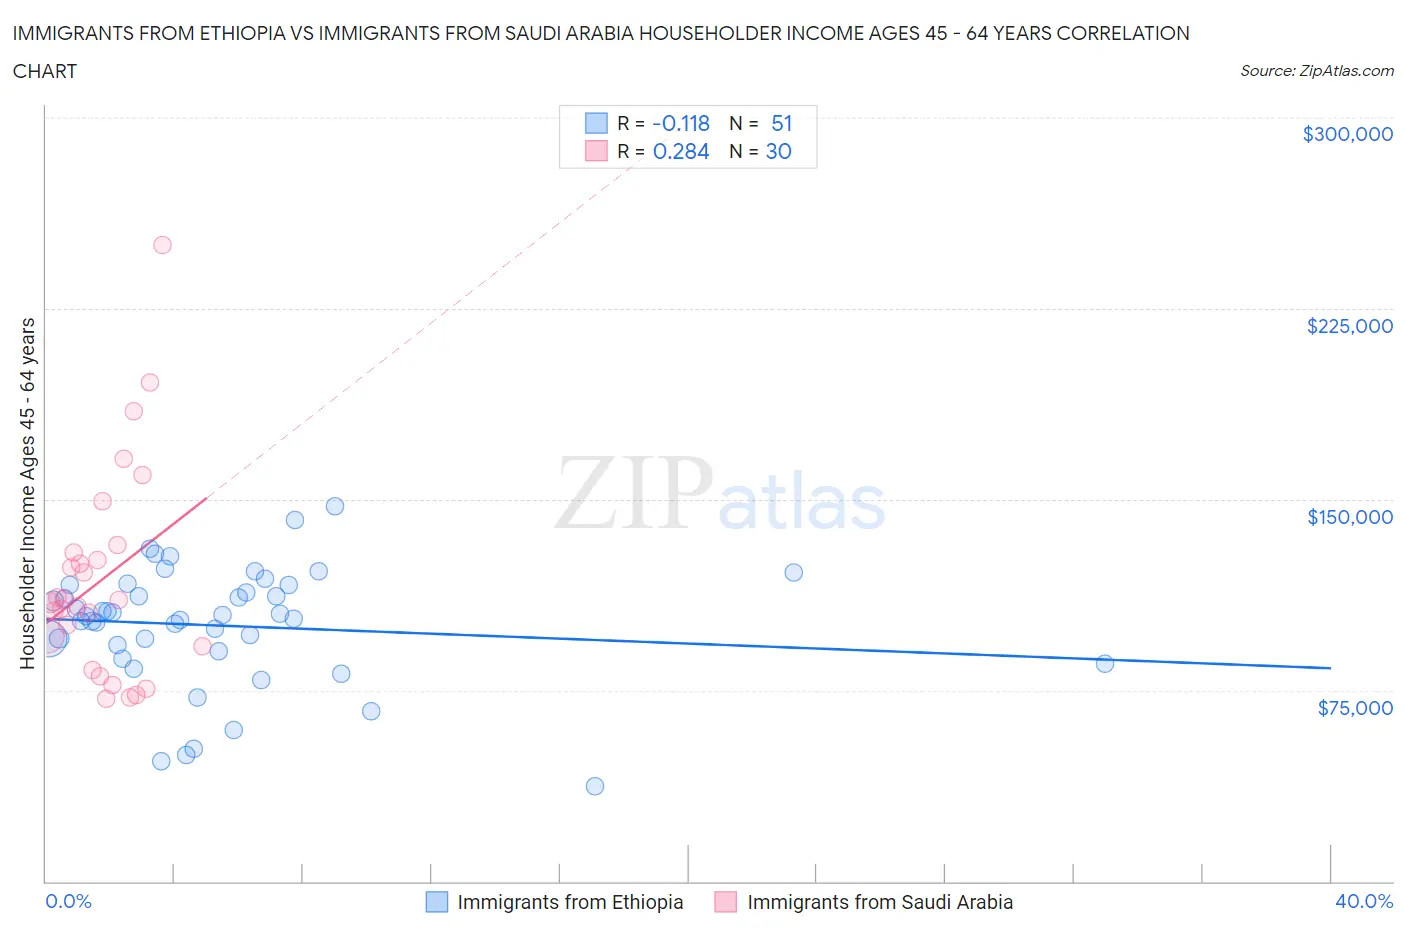
Immigrants from Ethiopia vs Immigrants from Saudi Arabia Householder Income Ages 45 - 64 years Correlation Chart
The statistical analysis conducted on geographies consisting of 211,332,039 people shows a poor negative correlation between the proportion of Immigrants from Ethiopia and household income with householder between the ages 45 and 64 in the United States with a correlation coefficient (R) of -0.118 and weighted average of $102,763. Similarly, the statistical analysis conducted on geographies consisting of 164,122,820 people shows a weak positive correlation between the proportion of Immigrants from Saudi Arabia and household income with householder between the ages 45 and 64 in the United States with a correlation coefficient (R) of 0.284 and weighted average of $105,249, a difference of 2.4%.
Householder Income Ages 45 - 64 years Correlation Summary
| Measurement | Immigrants from Ethiopia | Immigrants from Saudi Arabia |
| Minimum | $37,206 | $71,471 |
| Maximum | $147,240 | $250,001 |
| Range | $110,034 | $178,530 |
| Mean | $100,387 | $118,389 |
| Median | $104,236 | $109,917 |
| Interquartile 25% (IQ1) | $90,455 | $92,091 |
| Interquartile 75% (IQ3) | $116,400 | $128,959 |
| Interquartile Range (IQR) | $25,945 | $36,868 |
| Standard Deviation (Sample) | $23,411 | $40,687 |
| Standard Deviation (Population) | $23,180 | $40,003 |
Similar Demographics by Householder Income Ages 45 - 64 years
Demographics Similar to Immigrants from Ethiopia by Householder Income Ages 45 - 64 years
In terms of householder income ages 45 - 64 years, the demographic groups most similar to Immigrants from Ethiopia are Carpatho Rusyn ($102,777, a difference of 0.010%), Costa Rican ($102,779, a difference of 0.020%), Slovene ($102,885, a difference of 0.12%), Slavic ($102,629, a difference of 0.13%), and Scandinavian ($102,969, a difference of 0.20%).
| Demographics | Rating | Rank | Householder Income Ages 45 - 64 years |
| Immigrants | Peru | 80.7 /100 | #150 | Excellent $103,173 |
| Swiss | 79.9 /100 | #151 | Good $103,071 |
| Irish | 79.8 /100 | #152 | Good $103,067 |
| Scandinavians | 79.0 /100 | #153 | Good $102,969 |
| Slovenes | 78.3 /100 | #154 | Good $102,885 |
| Costa Ricans | 77.4 /100 | #155 | Good $102,779 |
| Carpatho Rusyns | 77.4 /100 | #156 | Good $102,777 |
| Immigrants | Ethiopia | 77.3 /100 | #157 | Good $102,763 |
| Slavs | 76.1 /100 | #158 | Good $102,629 |
| Sierra Leoneans | 74.2 /100 | #159 | Good $102,427 |
| Icelanders | 72.5 /100 | #160 | Good $102,261 |
| Immigrants | Nepal | 71.8 /100 | #161 | Good $102,190 |
| Scottish | 71.1 /100 | #162 | Good $102,123 |
| English | 70.1 /100 | #163 | Good $102,021 |
| Immigrants | Morocco | 70.0 /100 | #164 | Good $102,015 |
Demographics Similar to Immigrants from Saudi Arabia by Householder Income Ages 45 - 64 years
In terms of householder income ages 45 - 64 years, the demographic groups most similar to Immigrants from Saudi Arabia are Pakistani ($105,317, a difference of 0.060%), Portuguese ($105,309, a difference of 0.060%), Native Hawaiian ($105,149, a difference of 0.090%), Immigrants from Northern Africa ($105,430, a difference of 0.17%), and Peruvian ($105,070, a difference of 0.17%).
| Demographics | Rating | Rank | Householder Income Ages 45 - 64 years |
| Immigrants | South Eastern Asia | 94.8 /100 | #120 | Exceptional $106,109 |
| Poles | 94.4 /100 | #121 | Exceptional $105,952 |
| Immigrants | North Macedonia | 94.2 /100 | #122 | Exceptional $105,892 |
| Danes | 93.4 /100 | #123 | Exceptional $105,619 |
| Immigrants | Northern Africa | 92.8 /100 | #124 | Exceptional $105,430 |
| Pakistanis | 92.4 /100 | #125 | Exceptional $105,317 |
| Portuguese | 92.4 /100 | #126 | Exceptional $105,309 |
| Immigrants | Saudi Arabia | 92.2 /100 | #127 | Exceptional $105,249 |
| Native Hawaiians | 91.8 /100 | #128 | Exceptional $105,149 |
| Peruvians | 91.5 /100 | #129 | Exceptional $105,070 |
| Immigrants | Zimbabwe | 91.2 /100 | #130 | Exceptional $104,992 |
| Immigrants | Syria | 90.7 /100 | #131 | Exceptional $104,858 |
| Lebanese | 90.1 /100 | #132 | Exceptional $104,734 |
| Arabs | 89.3 /100 | #133 | Excellent $104,566 |
| Canadians | 89.3 /100 | #134 | Excellent $104,560 |