Immigrants from England vs Immigrants from Northern Europe Householder Income Ages 45 - 64 years
COMPARE
Immigrants from England
Immigrants from Northern Europe
Householder Income Ages 45 - 64 years
Householder Income Ages 45 - 64 years Comparison
Immigrants from England
Immigrants from Northern Europe
$109,446
HOUSEHOLDER INCOME AGES 45 - 64 YEARS
99.0/ 100
METRIC RATING
77th/ 347
METRIC RANK
$117,930
HOUSEHOLDER INCOME AGES 45 - 64 YEARS
100.0/ 100
METRIC RATING
27th/ 347
METRIC RANK
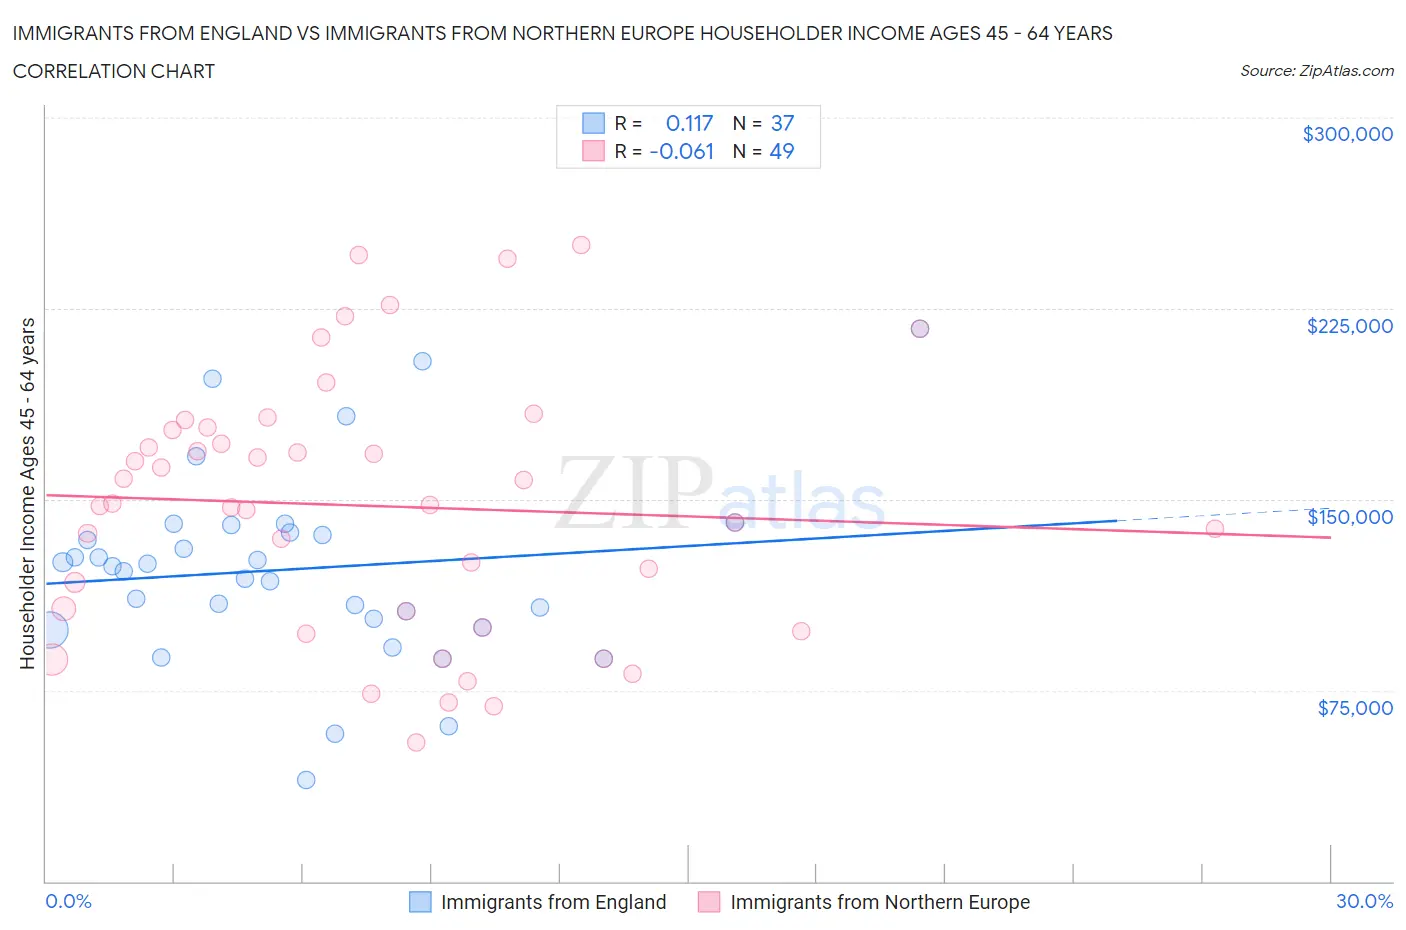
Immigrants from England vs Immigrants from Northern Europe Householder Income Ages 45 - 64 years Correlation Chart
The statistical analysis conducted on geographies consisting of 391,386,489 people shows a poor positive correlation between the proportion of Immigrants from England and household income with householder between the ages 45 and 64 in the United States with a correlation coefficient (R) of 0.117 and weighted average of $109,446. Similarly, the statistical analysis conducted on geographies consisting of 476,061,115 people shows a slight negative correlation between the proportion of Immigrants from Northern Europe and household income with householder between the ages 45 and 64 in the United States with a correlation coefficient (R) of -0.061 and weighted average of $117,930, a difference of 7.7%.
Householder Income Ages 45 - 64 years Correlation Summary
| Measurement | Immigrants from England | Immigrants from Northern Europe |
| Minimum | $39,802 | $54,375 |
| Maximum | $217,188 | $250,001 |
| Range | $177,386 | $195,626 |
| Mean | $122,668 | $147,439 |
| Median | $123,541 | $147,652 |
| Interquartile 25% (IQ1) | $101,375 | $102,957 |
| Interquartile 75% (IQ3) | $138,511 | $177,734 |
| Interquartile Range (IQR) | $37,136 | $74,777 |
| Standard Deviation (Sample) | $37,553 | $50,256 |
| Standard Deviation (Population) | $37,042 | $49,741 |
Similar Demographics by Householder Income Ages 45 - 64 years
Demographics Similar to Immigrants from England by Householder Income Ages 45 - 64 years
In terms of householder income ages 45 - 64 years, the demographic groups most similar to Immigrants from England are Paraguayan ($109,447, a difference of 0.0%), Immigrants from Canada ($109,402, a difference of 0.040%), Immigrants from Bulgaria ($109,379, a difference of 0.060%), Jordanian ($109,376, a difference of 0.060%), and Immigrants from Eastern Europe ($109,335, a difference of 0.10%).
| Demographics | Rating | Rank | Householder Income Ages 45 - 64 years |
| Koreans | 99.3 /100 | #70 | Exceptional $110,334 |
| Italians | 99.3 /100 | #71 | Exceptional $110,224 |
| Assyrians/Chaldeans/Syriacs | 99.3 /100 | #72 | Exceptional $110,201 |
| Argentineans | 99.3 /100 | #73 | Exceptional $110,103 |
| Immigrants | Egypt | 99.2 /100 | #74 | Exceptional $109,941 |
| South Africans | 99.1 /100 | #75 | Exceptional $109,719 |
| Paraguayans | 99.0 /100 | #76 | Exceptional $109,447 |
| Immigrants | England | 99.0 /100 | #77 | Exceptional $109,446 |
| Immigrants | Canada | 99.0 /100 | #78 | Exceptional $109,402 |
| Immigrants | Bulgaria | 98.9 /100 | #79 | Exceptional $109,379 |
| Jordanians | 98.9 /100 | #80 | Exceptional $109,376 |
| Immigrants | Eastern Europe | 98.9 /100 | #81 | Exceptional $109,335 |
| Immigrants | North America | 98.8 /100 | #82 | Exceptional $109,198 |
| Immigrants | Spain | 98.8 /100 | #83 | Exceptional $109,051 |
| Immigrants | Western Europe | 98.6 /100 | #84 | Exceptional $108,824 |
Demographics Similar to Immigrants from Northern Europe by Householder Income Ages 45 - 64 years
In terms of householder income ages 45 - 64 years, the demographic groups most similar to Immigrants from Northern Europe are Turkish ($117,814, a difference of 0.10%), Bhutanese ($117,750, a difference of 0.15%), Immigrants from Bolivia ($117,731, a difference of 0.17%), Immigrants from Sweden ($118,318, a difference of 0.33%), and Asian ($118,426, a difference of 0.42%).
| Demographics | Rating | Rank | Householder Income Ages 45 - 64 years |
| Immigrants | Australia | 100.0 /100 | #20 | Exceptional $119,308 |
| Immigrants | Sri Lanka | 100.0 /100 | #21 | Exceptional $119,094 |
| Immigrants | Belgium | 100.0 /100 | #22 | Exceptional $118,932 |
| Bolivians | 100.0 /100 | #23 | Exceptional $118,871 |
| Immigrants | Japan | 100.0 /100 | #24 | Exceptional $118,498 |
| Asians | 100.0 /100 | #25 | Exceptional $118,426 |
| Immigrants | Sweden | 100.0 /100 | #26 | Exceptional $118,318 |
| Immigrants | Northern Europe | 100.0 /100 | #27 | Exceptional $117,930 |
| Turks | 100.0 /100 | #28 | Exceptional $117,814 |
| Bhutanese | 100.0 /100 | #29 | Exceptional $117,750 |
| Immigrants | Bolivia | 100.0 /100 | #30 | Exceptional $117,731 |
| Immigrants | Asia | 100.0 /100 | #31 | Exceptional $116,566 |
| Russians | 100.0 /100 | #32 | Exceptional $116,328 |
| Chinese | 100.0 /100 | #33 | Exceptional $116,156 |
| Immigrants | Denmark | 100.0 /100 | #34 | Exceptional $116,000 |